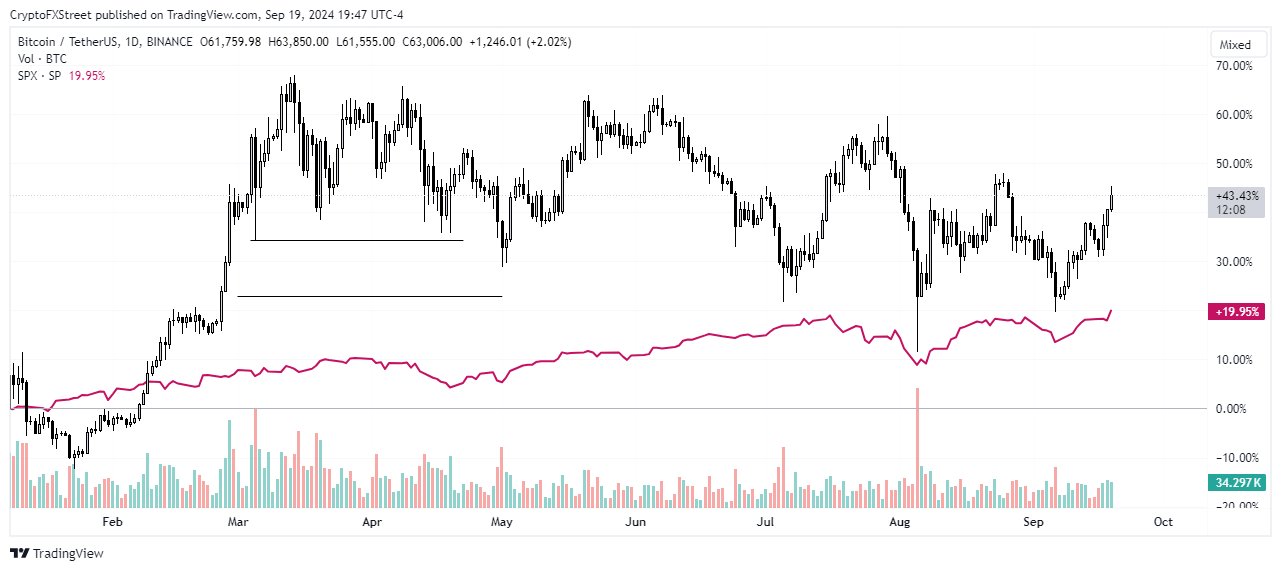
Bitcoin is showing rising correlation with the S&P 500
- Bitcoin and the S&P 500 have exhibited similar price patterns in the past few months.
- The rising correlation could be due to institutional players entering the crypto market and Fed's recent rate cut.
- Bitcoin has outperformed over 250 altcoins in the top 300 since the beginning of the year.
Bitcoin's (BTC) price rallied alongside the S&P 500 (SPX) on Thursday, strengthening its rising correlation with the index in 2024.
Bitcoin has moved largely in tandem with S&P 500 in past few months
Bitcoin and the crypto market have been in an uptrend since Wednesday following the Federal Reserve's (Fed) decision to cut interest rates by 50 basis points. Bitcoin is up nearly 3% in the past 24 hours, rising briefly above the $63,000 level for the first time in three weeks.
Since hitting a low of $53,300 on September 6, Bitcoin has rallied over 17%, adding more than $200 billion in market capitalization.
However, the recent rally isn't peculiar to Bitcoin and cryptocurrencies alone, as US stocks have also been on an uptrend.
Since the Fed announced the rate cut, the S&P 500 has added nearly $1 trillion in market capitalization. Like Bitcoin, the index has also seen an impressive recovery from a low on September 6, gaining over $3 trillion in market cap.
Besides bullish seasons, Bitcoin and the S&P 500 have followed the same pattern in recent bearish periods. The index dropped nearly 10% days after the “yen carry trade” unwinding. In the same period, Bitcoin went below $50,000
The move underscores Bitcoin's rising correlation with the S&P 500 in recent months.

BTC/USDT vs SPX
A potential reason for the rising correlation could be traced to the increased participation of institutional players in the crypto market through the launch of Bitcoin and Ethereum exchange-traded funds (ETFs). Additionally, the anticipation and eventual Fed rate cut is expected to see investors deploy capital into risk assets like crypto and stocks, causing a potential simultaneous rise in both assets.
While the correlation exists for now, it's important to note that it can change unexpectedly, especially due to the somewhat unclear regulatory hurdle Bitcoin faces and high speculative behavior of most crypto investors.
Meanwhile, a recent chart by @MustStopMurad on X shows that only 42 cryptocurrencies in the top 300 outperformed Bitcoin since the beginning of the year. He further highlighted that most of the 42 cryptocurrencies were recently launched tokens, and the others were largely meme coins. As a result, Bitcoin has proven a better bet than the larger percentage of reputable altcoins.
Only 42 tokens among the Top 300 on CoinMarketCap have outperformed BTC in 2024 Year-to-Date, according to @MustStopMurad. 11 of the top 15 tokens are MEME. 20 tokens were listed on Binance last year or earlier, and 5 tokens listed on Binance in 2024. pic.twitter.com/DDL0cBfzhq
— Wu Blockchain (@WuBlockchain) September 19, 2024
Bitcoin, altcoins, stablecoins FAQs
Bitcoin is the largest cryptocurrency by market capitalization, a virtual currency designed to serve as money. This form of payment cannot be controlled by any one person, group, or entity, which eliminates the need for third-party participation during financial transactions.
Altcoins are any cryptocurrency apart from Bitcoin, but some also regard Ethereum as a non-altcoin because it is from these two cryptocurrencies that forking happens. If this is true, then Litecoin is the first altcoin, forked from the Bitcoin protocol and, therefore, an “improved” version of it.
Stablecoins are cryptocurrencies designed to have a stable price, with their value backed by a reserve of the asset it represents. To achieve this, the value of any one stablecoin is pegged to a commodity or financial instrument, such as the US Dollar (USD), with its supply regulated by an algorithm or demand. The main goal of stablecoins is to provide an on/off-ramp for investors willing to trade and invest in cryptocurrencies. Stablecoins also allow investors to store value since cryptocurrencies, in general, are subject to volatility.
Bitcoin dominance is the ratio of Bitcoin's market capitalization to the total market capitalization of all cryptocurrencies combined. It provides a clear picture of Bitcoin’s interest among investors. A high BTC dominance typically happens before and during a bull run, in which investors resort to investing in relatively stable and high market capitalization cryptocurrency like Bitcoin. A drop in BTC dominance usually means that investors are moving their capital and/or profits to altcoins in a quest for higher returns, which usually triggers an explosion of altcoin rallies.


