

Is Ethereum Primed For Surge? Analyst Reveals Key Levels to Watch For A $8,100 Rally

Source Newsbtc

Regardless of the Ethereum (ETH) price’s unappealing performance, the latest analysis from top crypto analysts in the space predicts that the asset might be on the verge of a parabolic rise.

In a recent post uploaded on X, renowned crypto analyst Javon Marks has laid out an optimistic scenario for Ethereum, suggesting a potential price surge similar to a pattern witnessed in 2023.

Key Level To Watch For A Rally To $8,100?

According to Marks, Ethereum is poised to replicate a previous pattern that led to a more than 160% surge. In the post on X, he states, “ETH looks to have replicated a pattern from 2023 that led into an over +165% climb, and it’s looking to be ‘GO TIME’ again.”

Marks has set a target price of $4,723.5, adding that a break above this price mark could bring in the possibility of Ethereum reaching above $8,100. This projection suggests a near doubling of Ethereum’s current price if this trend materializes.

Despite this optimistic forecast, Ethereum’s recent market performance has shown bearish tendencies. In the past 24 hours alone, ETH has declined by 4.5%, causing its price to fall below the $2,400 mark—a level it briefly traded above over the weekend.

Ethereum (ETH) price chart on TradingView

Ethereum Price: On The Flip Side

While Javon Marks’ analysis points towards a bullish future for Ethereum, other market analysts have outlined the critical support zones that Ethereum must hold to prevent further decline.

Ali, another well-known crypto analyst, has highlighted a crucial support range between $2,290 and $2,360. This zone, according to Ali, is significant as it is where roughly 1.90 million addresses hold around 52.30 million ETH.
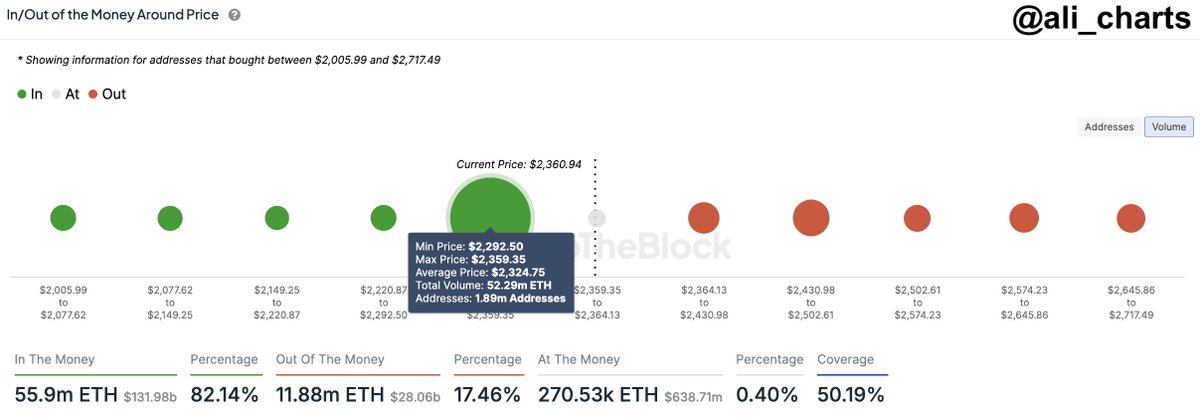
Ethereum in/out of the money around price.

Ali warns that if Ethereum fails to maintain this support, a sell-off could ensue, potentially driving the price toward the $1,800 level.

Notably, a breach below this range would be quite detrimental to the ETH market as it would not only trigger a significant amount of liquidations but also invalidate the bullish predictions and lead to a further downtrend, marking a substantial shift in the market sentiment.

Featured image created DALL-E, Chart from Tradingview

Disclaimer: For information purposes only. Past performance is not indicative of future results.
placeholder
【Daily Brief】10-year Treasury yield briefly tops 5%, S&P 500 slips to 7,602 and the dollar firms at 99.3 as the Fed's decision eve beginsThe 10-year Treasury yield touched 5.014% on Monday — its first print above 5% since October 2023 — while the S&P 500 closed 0.48% lower at 7,619.98 and the dollar index firmed to 99.3. Here is the full market wrap ahead of Wednesday's FOMC decision, the dot plot and the August retail sales report, plus today's CLARITY Act Senate vote.
Author  Irene Q.
Sep 15, Tue
The 10-year Treasury yield touched 5.014% on Monday — its first print above 5% since October 2023 — while the S&P 500 closed 0.48% lower at 7,619.98 and the dollar index firmed to 99.3. Here is the full market wrap ahead of Wednesday's FOMC decision, the dot plot and the August retail sales report, plus today's CLARITY Act Senate vote.
placeholder
October hike odds climb toward 60% as Goldman and BofA both flip — what Warsh's "dose of accommodation" really changedRate futures now price roughly 55% to 62% for a 25bp hike at the October 27-28 FOMC, up from about 30% before Chair Warsh's post-meeting framing that the Fed is merely "removing some accommodation." Goldman Sachs has added an October hike to its forecast and Bank of America now sees moves in both October and December. Here is the repricing, the language behind it, and the two data points that decide it.
Author  Irene Q.
Sep 23, Wed
Rate futures now price roughly 55% to 62% for a 25bp hike at the October 27-28 FOMC, up from about 30% before Chair Warsh's post-meeting framing that the Fed is merely "removing some accommodation." Goldman Sachs has added an October hike to its forecast and Bank of America now sees moves in both October and December. Here is the repricing, the language behind it, and the two data points that decide it.
placeholder
Memory chips surge, Nasdaq notches a second straight record close — why the Dow fell 185 points anywayMicron gained 5%, SanDisk 6.8%, Seagate 4% and Western Digital 3% as the memory complex led the Nasdaq Composite to a second consecutive record close of 27,244.28. But the Dow fell 185 points as JPMorgan, Wells Fargo and Schwab slid more than 3% each — a split tape that says more about positioning than about the economy.
Author  Irene Q.
Sep 23, Wed
Micron gained 5%, SanDisk 6.8%, Seagate 4% and Western Digital 3% as the memory complex led the Nasdaq Composite to a second consecutive record close of 27,244.28. But the Dow fell 185 points as JPMorgan, Wells Fargo and Schwab slid more than 3% each — a split tape that says more about positioning than about the economy.
placeholder
US input costs rose at the fastest pace in four years — the September flash PMI beat is an inflation story, not a growth storyUS September flash PMIs came in far above expectations, with the composite at 58.4, a five-year high. But the detail that moved markets was input cost inflation at its fastest since October 2022, driven by fuel, transport and supply shortages. Brent is back above $100 and the 10-year Treasury yield has hit its highest since 2007.
Author  Suzie
Sep 24, Thu
US September flash PMIs came in far above expectations, with the composite at 58.4, a five-year high. But the detail that moved markets was input cost inflation at its fastest since October 2022, driven by fuel, transport and supply shortages. Brent is back above $100 and the 10-year Treasury yield has hit its highest since 2007.
placeholder
WTI (USOIL) Is down 2.03% on Sep 25: Here Is WhyWTI (USOIL) is down 2.03% at Sep 24 22:20(UTC+0), now at $92.517, with a 7-day down of 3.63%.What is driving WTI (USOIL)’s stock price down today?The drop in WTI crude oil prices was primarily driven by
Author  TradingKey
Sep 25, Fri
WTI (USOIL) is down 2.03% at Sep 24 22:20(UTC+0), now at $92.517, with a 7-day down of 3.63%.What is driving WTI (USOIL)’s stock price down today?The drop in WTI crude oil prices was primarily driven by
goTop
quote