

On-Chain Data Suggests Bitcoin Price Trend Reversal Is Yet To Occur — What’s Happening?

Source Newsbtc

The price of Bitcoin (BTC) ended the week on a good note after making a late rally on Friday, September 13. This recent price upswing has led to talks about the Bitcoin price making a comeback following a horrendous start to September.

Interestingly, the latest on-chain data suggests that the ongoing price recovery might not exactly be what it looks like. So, what then is happening with the price of Bitcoin?

Declining Volume Suggests Bitcoin Price Is Still In Downtrend

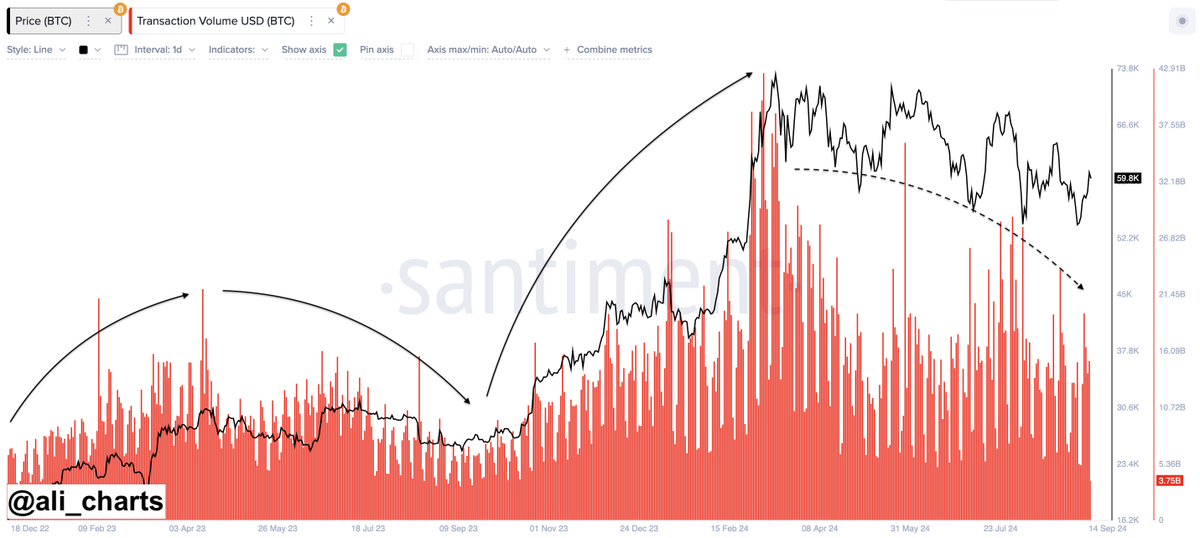
In a post on the X platform, popular crypto analyst Ali Martinez shared an on-chain observation that could offer insight into recent Bitcoin price action. The relevant indicator here is Santiment’s transaction volume metric, which monitors the total amount of a cryptocurrency transacted within a given time interval.

Historically, the transaction volume metric can be associated with the strength and direction of the market’s price trends. According to Martinez, Bitcoin’s transaction volume tends to rise during periods of upward price movement, as the market is usually more active. On the other hand, BTC’s transaction volume typically decreases during a price downtrend, as market participants engage less in buying and selling activities. 
bitcoin price

As of now, the Bitcoin transaction volume continues to fall, implying that even though the Bitcoin price seems to be recovering, a definitive trend reversal has not yet occurred. This sustained decline in volume indicates market uncertainty, suggesting that the price of Bitcoin may continue to consolidate or even experience further downward movement.

The reduced market activity could be associated with the bearish history of BTC in September, with investors likely choosing to navigate the market with more caution. Ultimately, this indicates that the latest Bitcoin rally may be short-lived, with the premier cryptocurrency likely not to build on its recent momentum. 

Bitcoin Whales Realize $50 Million In Profit 

It appears that some Bitcoin holders are not waiting for the flagship cryptocurrency to resume its bull run to cash in on their profits. For instance, on-chain data shows that some large investors accrued a significant amount in profit following the recent Bitcoin price rally above $60,000.

Ali Martinez revealed in a separate post on X that BTC whales took advantage of the recent price spike to realize more than $50 million in profits. This is based on an increase in long-term holder whales’ realized profit (in USD), implying that old large investors sold their coins at a higher price than the acquisition price.

This level of profit-taking can be a negative signal for the premier cryptocurrency, as large sell-offs can cause downward pressure on the Bitcoin price. Interestingly, the price of BTC has not made any significant movement in the past day and continues to hover around the $60,000 level.

Bitcoin price
Disclaimer: For information purposes only. Past performance is not indicative of future results.
placeholder
US dollar clings to nine-week lows near 98.4 as Brent nears $100 and the yen hits a seven-month high — five events to watch todayThe dollar is pinned near nine-week lows even after a blockbuster jobs report, as an oil spike toward $100, a surging yen and China's reflation data crowd the driver's seat. Five key events to watch today: Brent at $99.46, USD/JPY at 154, China CPI/PPI, PBOC gold buying, and Thursday's PPI / Friday's CPI ahead of the September 15-16 FOMC.
Author  Eric Nkando
Sep 09, Wed
The dollar is pinned near nine-week lows even after a blockbuster jobs report, as an oil spike toward $100, a surging yen and China's reflation data crowd the driver's seat. Five key events to watch today: Brent at $99.46, USD/JPY at 154, China CPI/PPI, PBOC gold buying, and Thursday's PPI / Friday's CPI ahead of the September 15-16 FOMC.
placeholder
US August CPI lands tonight: after a 5.4% PPI shock, will the Fed hike on September 16?US August PPI came in at 5.4% year-on-year, above the 5.3% consensus, with core PPI at 4.6%. Traders have pushed the odds of a 25bp Fed hike on September 15-16 to around 70%. Tonight's CPI is the last major inflation print before the decision — here is the full calendar, the consensus numbers, and what a hot versus cool reading would mean for the dollar, yields, gold and stocks.
Author  Irene Q.
Sep 11, Fri
US August PPI came in at 5.4% year-on-year, above the 5.3% consensus, with core PPI at 4.6%. Traders have pushed the odds of a 25bp Fed hike on September 15-16 to around 70%. Tonight's CPI is the last major inflation print before the decision — here is the full calendar, the consensus numbers, and what a hot versus cool reading would mean for the dollar, yields, gold and stocks.
placeholder
Brent tests $108 as a key export pipeline stays shut — can the rally clear $110?Brent crude rose 2.55% to $106.97 and WTI 2.32% to $102.30 as a major regional export pipeline remained offline with no restart timeline. Front-month backwardation has widened to $5.53 from $3.84 a week ago, European gas is at its highest since December 2022, and one analyst sees $119.48 if talks stall.
Author  Irene Q.
18 hours ago
Brent crude rose 2.55% to $106.97 and WTI 2.32% to $102.30 as a major regional export pipeline remained offline with no restart timeline. Front-month backwardation has widened to $5.53 from $3.84 a week ago, European gas is at its highest since December 2022, and one analyst sees $119.48 if talks stall.
placeholder
Fed hike odds near 90% into Wednesday's decision — how to trade the dollar, gold and the S&P 500A 0.3% monthly core CPI print has lifted the market-implied probability of a 25bp Fed hike on 16 September to roughly 86.5% ~ 90%, which would be the first increase since July 2023. Here is the decision timeline, the pricing versus the forecasts, both scenarios, and the key levels for the dollar, gold and the S&P 500.
Author  Suzie
17 hours ago
A 0.3% monthly core CPI print has lifted the market-implied probability of a 25bp Fed hike on 16 September to roughly 86.5% ~ 90%, which would be the first increase since July 2023. Here is the decision timeline, the pricing versus the forecasts, both scenarios, and the key levels for the dollar, gold and the S&P 500.
placeholder
Silver Price Forecast: XAG/USD falls to near $63.50 amid Fed hike bets, higher oil pricesSilver price (XAG/USD) loses its gains from the previous day, trading around $63.50 per troy ounce during Asian hours on Monday. Non-yielding Silver is currently facing significant headwinds driven by rising Federal Reserve (Fed) rate-hike expectations for the upcoming September decision.
Author  FXStreet
15 hours ago
Silver price (XAG/USD) loses its gains from the previous day, trading around $63.50 per troy ounce during Asian hours on Monday. Non-yielding Silver is currently facing significant headwinds driven by rising Federal Reserve (Fed) rate-hike expectations for the upcoming September decision.
goTop
quote