


Ethereum investors shed holdings following potential SEC admission on ETH's security status
- SEC may have confirmed that Ethereum is not a security following eToro's settlement.
- Ethereum is seeing high selling pressure from investors as exchanges witness 91.4K ETH inflows.
- Ethereum could rally toward $3,360 if it breaks above the upper trendline of a falling wedge with high buying pressure.
Ethereum (ETH) is up 0.5% on Thursday following speculation that the Securities & Exchange Commission (SEC) confirmed that the top altcoin is not a security. Meanwhile, ETH is experiencing high exchange inflows, indicating rising selling pressure among investors.
Daily digest market movers: SEC's potential Ethereum admission, exchange inflows
Crypto community members are speculating that the SEC conceded that Ethereum isn't a security following its settlement with crypto exchange eToro. The exchange removed tokens the SEC deemed as "investment contracts" from its platform, allowing users to trade only Bitcoin, Bitcoin Cash and Ethereum.
Considering the SEC didn't include Ethereum among the list of tokens it asked eToro to delist, many concluded that it's a confirmation that the number one altcoin is not a security.
"They [SEC] just conceded ETH is not offered as an investment contract security in secondary markets," said Paul Grewal, Coinbase's chief legal officer.
On the heels of the news, Hong Kong digital asset manager Metalpha potentially resumed its Ethereum selling spree after depositing 6,999 ETH worth $16.4 million to Binance in the past few hours, per Lookonchain. The asset manager has depleted its ETH holdings in the past six days by 62,588 ETH worth $145.1 million. The company still has 23.5K ETH worth $55 million to initiate further selling pressure.
Ethereum exchange net flows show that Metalpha isn't the only entity potentially selling its ETH tokens. In the past 24 hours, exchanges recorded over 91.4K ETH in net inflows, per CryptoQuant's data.
 - All Exchanges (3)-638617711860936371.png)
ETH Exchange Net Flow
Exchange net flows is the difference between coins flowing in and out of an exchange. Unlike exchange-traded funds (ETF), crypto exchange inflows indicate high selling pressure and vice versa for outflows.
Meanwhile, Ethereum ETFs saw mild net outflows of $500,000 on Wednesday. Notably, Grayscale's ETHE recorded a second consecutive day of zero flows — the first time since ETH ETF's launch.
ETH technical analysis: Ethereum needs to break out of falling wedge to kick-start rally
Ethereum is trading around $2,350 on Thursday, up 0.5% on the day. In the past 24 hours, ETH has seen $14.73 million in liquidations, with long and short liquidations accounting for $9.98 million and $4.75 million, respectively.
On the 4-hour chart, Ethereum is trading within a falling wedge, represented by an upper descending trendline from July 31 and a lower trendline from August 7. If ETH breaks above the upper trendline of the wedge with increased volume, it could see a massive rally toward the $3,366 level. A potential confirmation of the bullish move will be a retest of the trendline as a new support level.
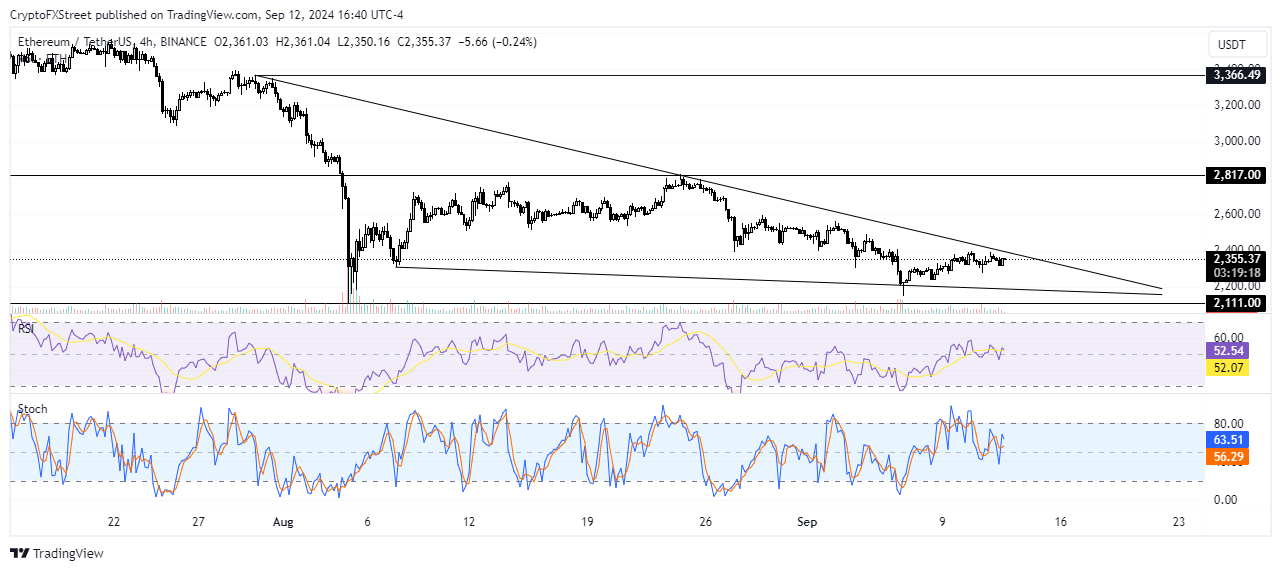
ETH/USDT 4-hour chart
On the way up, ETH faces a key resistance around the $2,817 level. A breakout above this level could strengthen the bullish move as it served as a key price support for over four months.
The Relative Strength Index (RSI) and Stochastic Oscillator (Stoch) are just above their neutral levels, indicating slight bullish momentum.
A daily candlestick close below the $2,111 price level will invalidate the bullish thesis.
In the short term, ETH could rise to $2,388 to liquidate positions worth over $32 million.
Ethereum FAQs
Ethereum is a decentralized open-source blockchain with smart contracts functionality. Serving as the basal network for the Ether (ETH) cryptocurrency, it is the second largest crypto and largest altcoin by market capitalization. The Ethereum network is tailored for scalability, programmability, security, and decentralization, attributes that make it popular among developers.
Ethereum uses decentralized blockchain technology, where developers can build and deploy applications that are independent of the central authority. To make this easier, the network has a programming language in place, which helps users create self-executing smart contracts. A smart contract is basically a code that can be verified and allows inter-user transactions.
Staking is a process where investors grow their portfolios by locking their assets for a specified duration instead of selling them. It is used by most blockchains, especially the ones that employ Proof-of-Stake (PoS) mechanism, with users earning rewards as an incentive for committing their tokens. For most long-term cryptocurrency holders, staking is a strategy to make passive income from your assets, putting them to work in exchange for reward generation.
Ethereum transitioned from a Proof-of-Work (PoW) to a Proof-of-Stake (PoS) mechanism in an event christened “The Merge.” The transformation came as the network wanted to achieve more security, cut down on energy consumption by 99.95%, and execute new scaling solutions with a possible threshold of 100,000 transactions per second. With PoS, there are less entry barriers for miners considering the reduced energy demands.
Recommended Articles


