

XRP Price Prediction: Crypto Whales’ $177 Million Buy Signals Rally

Source Beincrypto

XRP price has struggled to maintain a stable rise above the 50% Fibonacci retracement line at $0.60. The altcoin has repeatedly failed to break above this level, now finding itself stuck beneath the 38.2% Fib line at $0.55. 

Although the altcoin is showing signs of a potential recovery, the market remains cautious. Recent activity by large investors, particularly crypto whale addresses, has sparked optimism for an upward move in the XRP price. 

Crypto Whales to the Rescue

Crypto whale addresses, which hold between 10 million and 100 million XRP, have played a significant role in XRP’s price movements. Over the past week, these addresses have accumulated more than 330 million XRP, amounting to $177 million. This massive accumulation suggests that the crypto whales anticipate a price rise in the near term.

The influence of these crypto whale addresses on XRP’s price cannot be underestimated. Large accumulations tend to signal positive market sentiment, often leading to price rallies. Thus, leveraging this accumulation, XRP could experience renewed momentum, potentially breaking the resistance levels it has struggled with recently.

Read more: XRP ETF Explained: What It Is and How It Works
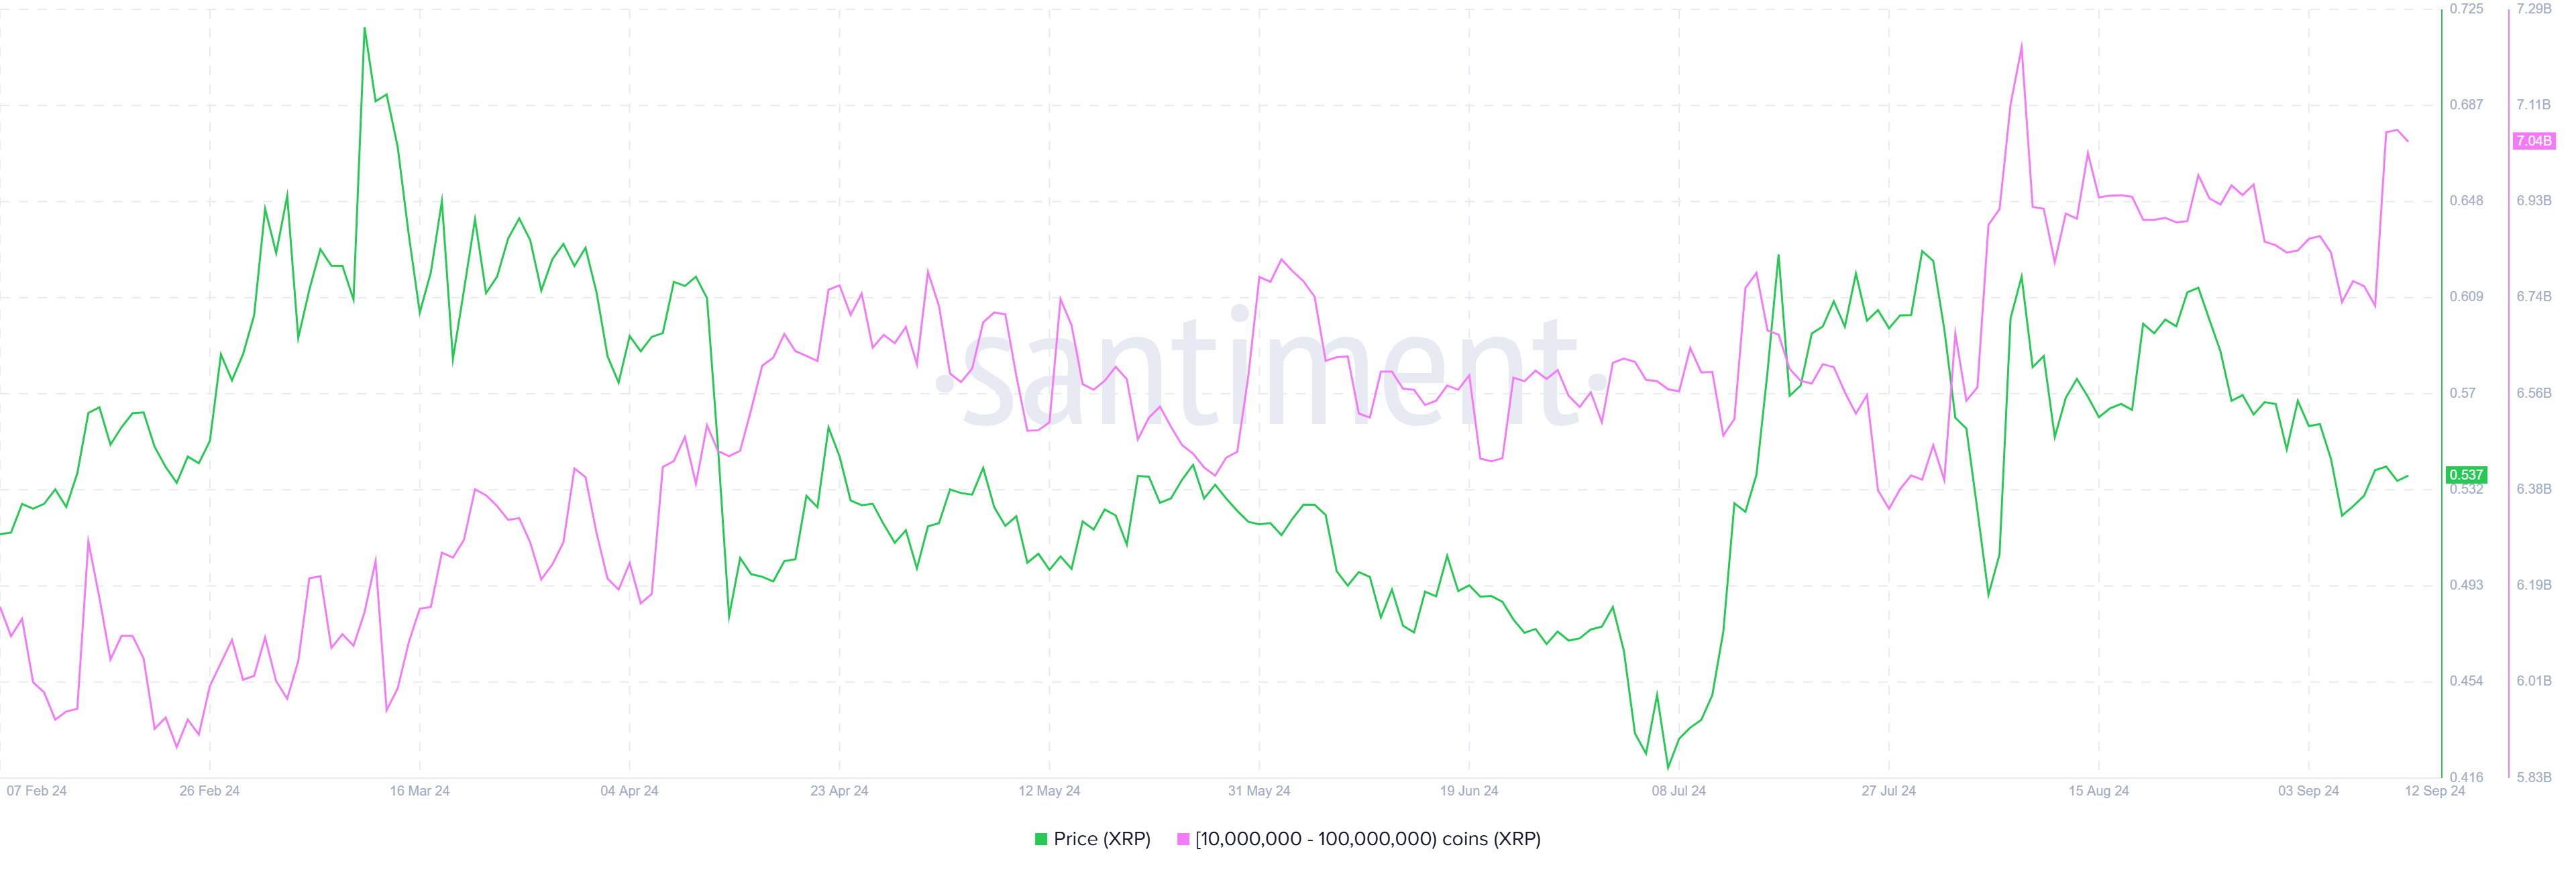
XRP Whale Accumulation. XRP Whale Accumulation. Source: Santiment

On the macro front, the Mean Coin Age (MCA) indicator provides insights into the behavior of XRP holders. Toward the end of August and the beginning of September, the MCA noted a downtick, indicating increased movement of XRP within addresses, a bearish signal. However, the last week has seen the MCA trend upward, suggesting that long-term holders are once again opting to HODL rather than move their XRP.

This shift in sentiment signals a return of confidence among investors, as the reduced movement of XRP within addresses indicates stability. The uptick in MCA suggests that the bullish momentum in XRP could be sustained, with HODLing behavior likely supporting price growth in the near future.
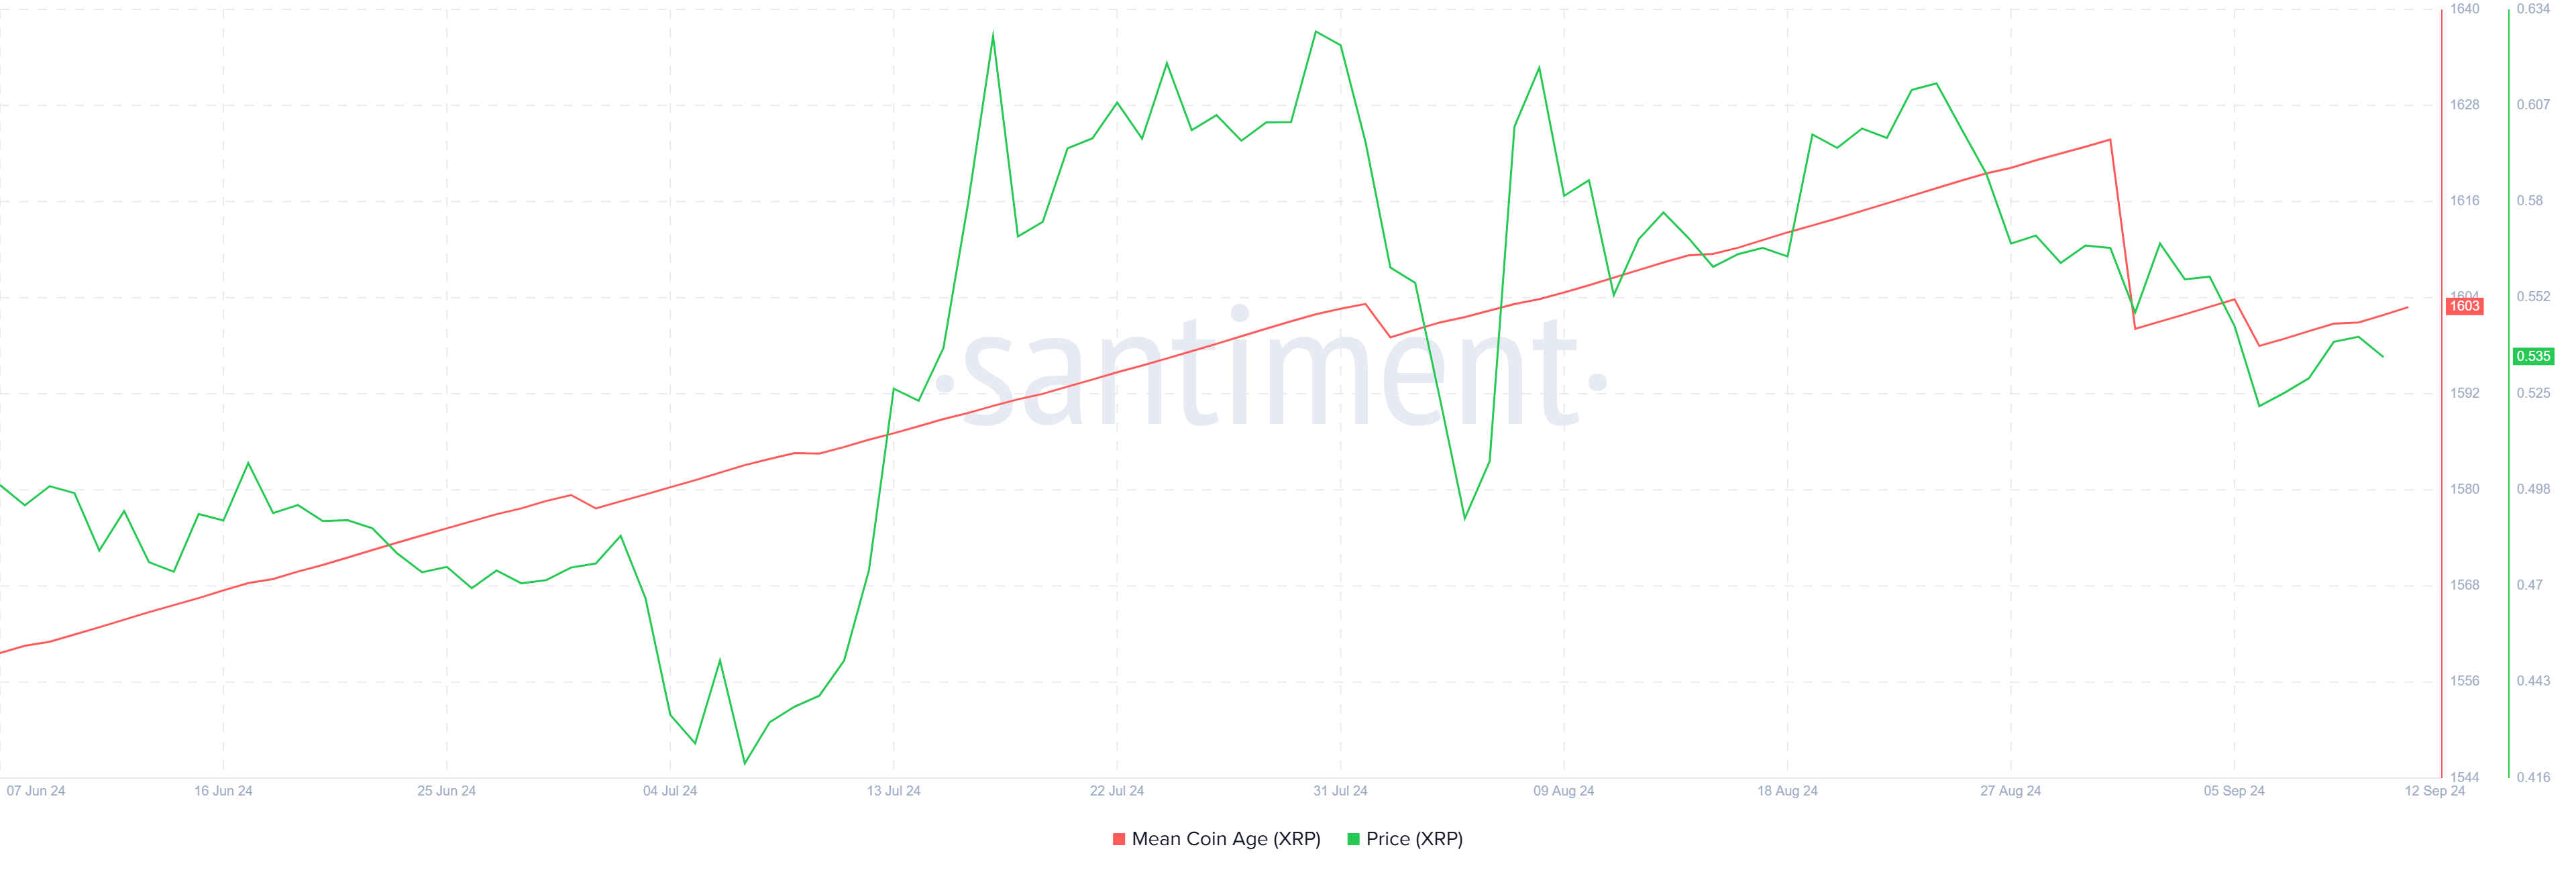
XRP MCA. XRP MCA. Source: Santiment

XRP Price Prediction: Minding Resistances

XRP has noted a modest 3% rise over the past five days, a positive yet underwhelming sign of recovery. The drop below the 38.2% Fibonacci retracement line at $0.55 could take time to overcome. This level has acted as resistance, keeping XRP below $0.55, similar to its consolidation phase from mid-April to mid-June.

However, the crypto whale accumulation and the uptick in MCA signal the potential for XRP to breach the $0.55 barrier. If this level flips into support, XRP could recover its early September losses, allowing the cryptocurrency to regain upward momentum and continue its ascent.

Read more: Ripple (XRP) Price Prediction 2024/2025/2030
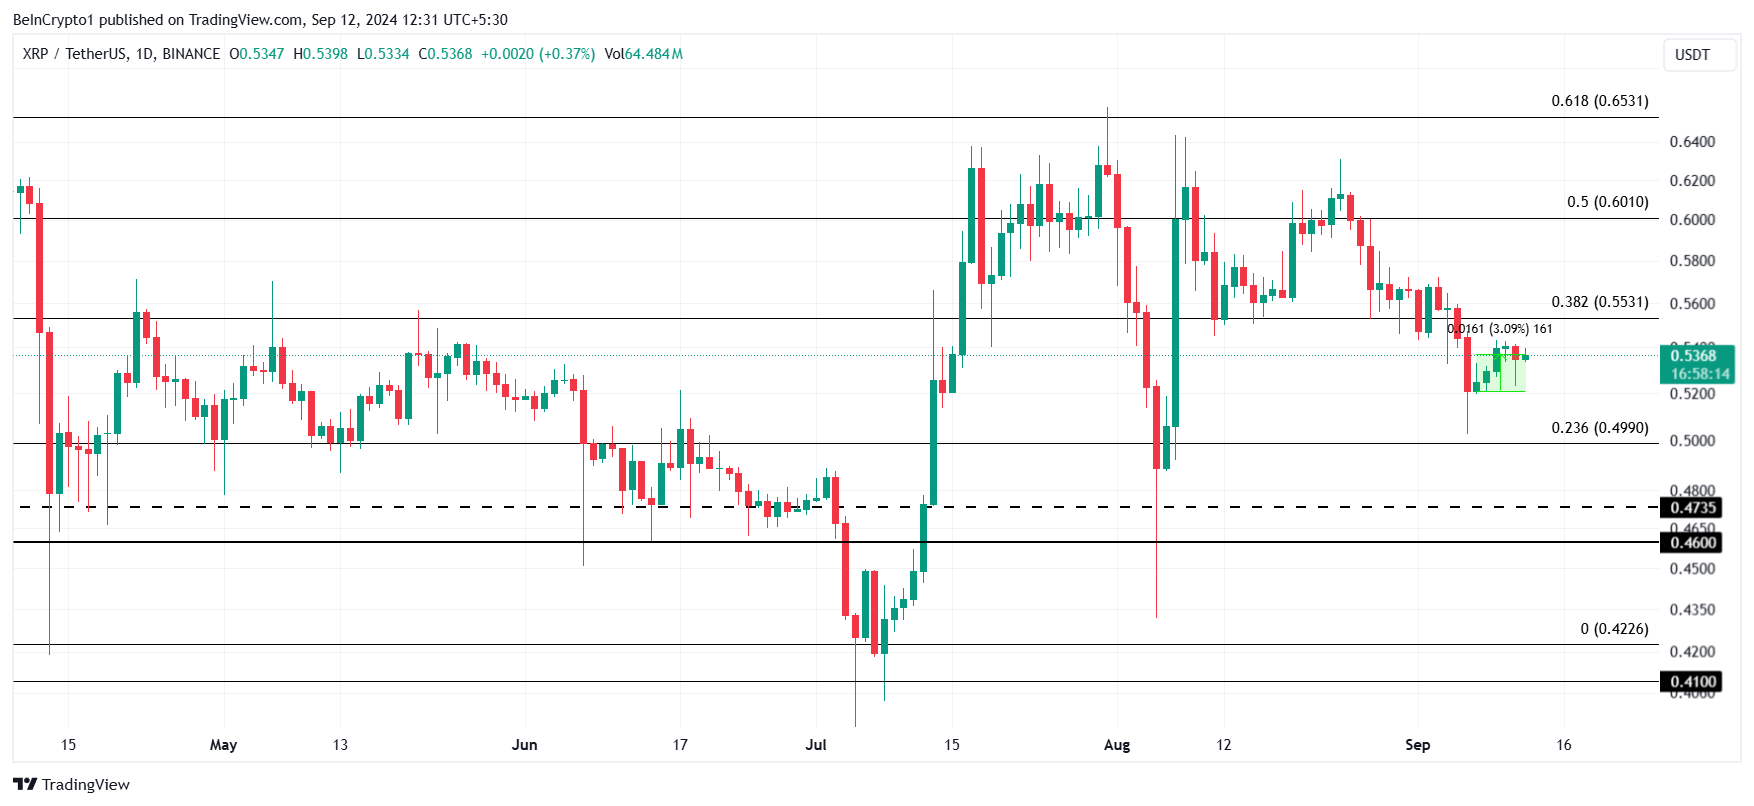
XRP Price Analysis. XRP Price Analysis. Source: TradingView

On the flip side, a failed breach of $0.55 would likely lead to XRP hovering between this level and the 23.6% Fib line at $0.49. This lower level, known as the bear market support floor, could act as a buffer, preventing further declines. However, consolidation here would invalidate the bullish outlook, keeping XRP’s price trapped for the foreseeable future.

Disclaimer: For information purposes only. Past performance is not indicative of future results.
placeholder
Fed hike odds near 90% into Wednesday's decision — how to trade the dollar, gold and the S&P 500A 0.3% monthly core CPI print has lifted the market-implied probability of a 25bp Fed hike on 16 September to roughly 86.5% ~ 90%, which would be the first increase since July 2023. Here is the decision timeline, the pricing versus the forecasts, both scenarios, and the key levels for the dollar, gold and the S&P 500.
Author  Suzie
Sep 14, Mon
A 0.3% monthly core CPI print has lifted the market-implied probability of a 25bp Fed hike on 16 September to roughly 86.5% ~ 90%, which would be the first increase since July 2023. Here is the decision timeline, the pricing versus the forecasts, both scenarios, and the key levels for the dollar, gold and the S&P 500.
placeholder
【Daily Brief】10-year Treasury yield briefly tops 5%, S&P 500 slips to 7,602 and the dollar firms at 99.3 as the Fed's decision eve beginsThe 10-year Treasury yield touched 5.014% on Monday — its first print above 5% since October 2023 — while the S&P 500 closed 0.48% lower at 7,619.98 and the dollar index firmed to 99.3. Here is the full market wrap ahead of Wednesday's FOMC decision, the dot plot and the August retail sales report, plus today's CLARITY Act Senate vote.
Author  Irene Q.
Sep 15, Tue
The 10-year Treasury yield touched 5.014% on Monday — its first print above 5% since October 2023 — while the S&P 500 closed 0.48% lower at 7,619.98 and the dollar index firmed to 99.3. Here is the full market wrap ahead of Wednesday's FOMC decision, the dot plot and the August retail sales report, plus today's CLARITY Act Senate vote.
placeholder
Silver breaks $64 as precious metals rebound — can gold hold the $4,280 line into the Fed decision?Silver has climbed back above $64 an ounce for the first time this week, leading a broad rebound across precious metals hours before the Federal Reserve delivers what is expected to be its first rate hike since 2023. Spot silver was last at $64.64, up 1.49% on the day, while gold reclaimed $4,300 and platinum and palladium both advanced. The question now is whether the bounce is a genuine turn — or a pause before the Fed's dot plot decides the next move.
Author  Suzie
Yesterday 08: 40
Silver has climbed back above $64 an ounce for the first time this week, leading a broad rebound across precious metals hours before the Federal Reserve delivers what is expected to be its first rate hike since 2023. Spot silver was last at $64.64, up 1.49% on the day, while gold reclaimed $4,300 and platinum and palladium both advanced. The question now is whether the bounce is a genuine turn — or a pause before the Fed's dot plot decides the next move.
placeholder
Dow drops 631 points as the Fed hikes — but futures are rebounding: what's next for US stocks?The Dow fell 631 points and the S&P 500 closed below 7,600 after the Fed hiked rates for the first time since 2023, with the dot plot showing 16 of 18 officials expect more tightening. Asia-session futures are already recovering — here are the levels and analyst views that decide whether 7,500 holds.
Author  Irene Q.
10 hours ago
The Dow fell 631 points and the S&P 500 closed below 7,600 after the Fed hiked rates for the first time since 2023, with the dot plot showing 16 of 18 officials expect more tightening. Asia-session futures are already recovering — here are the levels and analyst views that decide whether 7,500 holds.
placeholder
Dollar index tops 100 for the first time since July as the Fed's hawkish dot plot sinks inThe U.S. dollar index broke back above 100 for the first time since 31 July after the Fed delivered its first rate hike since 2023, with the dot plot showing 16 of 18 officials expect at least one more increase this year. Here are the levels that matter for DXY, the currencies feeling it most, and what to watch next.
Author  Irene Q.
10 hours ago
The U.S. dollar index broke back above 100 for the first time since 31 July after the Fed delivered its first rate hike since 2023, with the dot plot showing 16 of 18 officials expect at least one more increase this year. Here are the levels that matter for DXY, the currencies feeling it most, and what to watch next.
goTop
quote