Render could rally if it sustains an extended move above key resistance

Source Fxstreet
  • Render is attempting to break above a key rectangle channel's $5.155 resistance level.
  • A successful move above this resistance could send Render toward the $6.097 level.
  • A notable uptick in the 30-day MVRV could cause Render to witness high selling pressure.

Render is down 2% on Wednesday as it attempts to break above the $5.155 key resistance level. This move could trigger a rally and cause a notable uptick in average gains for investors who purchased it within the last 30 days.

Render attempts move above key resistance

Render fell below the $5.155 resistance level of a key rectangle channel on Wednesday after briefly moving above it earlier on Tuesday. In the past month, Render has sustained several sideways moves within this channel.

While the AI token is looking to retest the $5.155 resistance again, it's restricted by the 200-day Simple Moving Average (SMA). An extended move above the 200-day SMA could flip the $5.155 resistance into a support and stage a rally toward the $6.097 level. Conversely, if it sees another rejection around $5.155, it could decline toward the $4.274 support level.
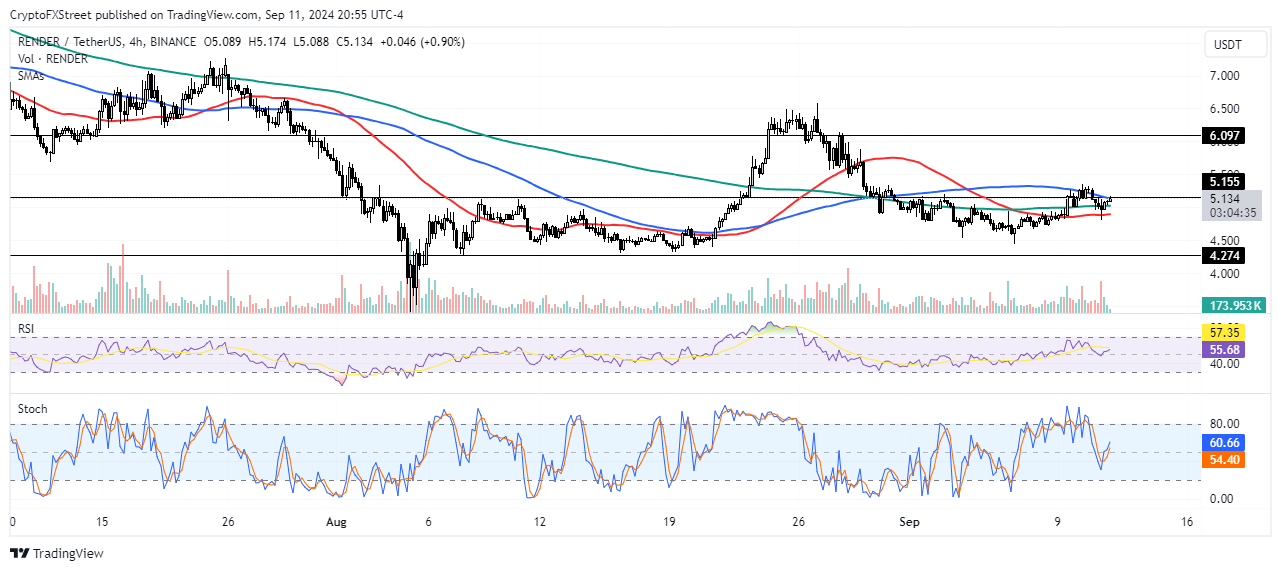
RENDER/USDT 4-hour chart

RENDER/USDT 4-hour chart

The Relative Strength Index (RSI) is at 52, just above the neutral level, indicating bullish momentum. The Stochastic Oscillator (Stoch) is below the neutral level at 47.

Render's Futures Open Interest (OI) has also been rising, increasing from $30.22 million on September 8 to $39.08 million on Wednesday. Open interest is the total number of unsettled long and short contracts within a derivatives market. The rising OI indicates that investors are increasingly placing bets on the price of Render. If prices are rising alongside it, the OI supports a bullish move.

RENDER Open Interest

RENDER Open Interest

On the monthly time frame, Render is trading at a 9% gain. However, its 60-day, 90-day, 180-day and 365-day Market Value to Realized Value (MVRV) shows investors who bought Render in the past three months and upward are holding their tokens at an average loss, meaning they're less likely to sell at current prices.

The MVRV indicates the average profits or loss of all addresses that purchased a token within a specific time frame.

RENDER 30-day, 60-day, 90-day, 180-day, 365-day MVRV

RENDER 30-day, 60-day, 90-day, 180-day, 365-day MVRV

Meanwhile, Render's 30-day MVRV ratio indicates that investors who bought in the past month are only seeing an average gain of 2%. Hence, this cohort of investors is less likely to cause any selling pressure currently with such a tiny profit margin. However, a rally toward $6.097 could cause massive profit-taking among this cohort and a subsequent price correction.

A daily candlestick close below $4.74 would invalidate the thesis.

Disclaimer: For information purposes only. Past performance is not indicative of future results.
placeholder
Why a Quiet 2025 Signals a Massive 2026 Crypto Bull Run: Bitwise CIO ExplainsBitwise's Matt Hougan Predicts a Crypto Boom in 2026 Amid Current Market Struggles
Author  Mitrade
Nov 13, Thu
Bitwise's Matt Hougan Predicts a Crypto Boom in 2026 Amid Current Market Struggles
placeholder
Gold Price Forecast: XAU/USD recovers above $4,100, hawkish Fed might cap gainsGold price (XAU/USD) recovers some lost ground to near $4,105, snapping the two-day losing streak during the early European session on Friday. The precious metal edges higher on the softer US Dollar (USD).  Traders will take more cues from the Fedspeak later on Monday.
Author  FXStreet
Yesterday 01: 52
Gold price (XAU/USD) recovers some lost ground to near $4,105, snapping the two-day losing streak during the early European session on Friday. The precious metal edges higher on the softer US Dollar (USD).  Traders will take more cues from the Fedspeak later on Monday.
placeholder
Bitcoin slides deeper into red as bears lean on $96,600 wall and eye $90,000Bitcoin extends its decline after failing to reclaim $96,500, trading below $95,000, the 100-hour SMA and a bearish trend line near $96,600; unless bulls can force a decisive close back above $96,600–$97,200, the short-term path of least resistance stays lower, with $92,500, $90,000 and the main $88,500 support zone in focus.
Author  Mitrade
Yesterday 03: 35
Bitcoin extends its decline after failing to reclaim $96,500, trading below $95,000, the 100-hour SMA and a bearish trend line near $96,600; unless bulls can force a decisive close back above $96,600–$97,200, the short-term path of least resistance stays lower, with $92,500, $90,000 and the main $88,500 support zone in focus.
placeholder
Bitcoin briefly loses 2025 gains as crypto plunges over the weekend.Bitcoin experienced a sharp decline this weekend, briefly erasing its 2025 gains and dipping below its year-opening value of $93,507. The cryptocurrency fell to a low of $93,029 on Sunday, representing a 25% drop from its all-time high in October. Although it has rebounded slightly to around $94,209, the pressures on the market remain significant. The downturn occurred despite the reopening of the U.S. government on Thursday, which many had hoped would provide essential support for crypto markets. This year initially appeared promising for cryptocurrencies, particularly after the inauguration of President Donald Trump, who has established the most pro-crypto administration thus far. However, ongoing political tensions—including Trump's tariff strategies and the recent government shutdown, lasting a historic 43 days—have contributed to several rapid price pullbacks for Bitcoin throughout the year. Market dynamics are also being influenced by Bitcoin whales—investors holding large amounts of Bitcoin—who have been offloading portions of their assets, consequently stalling price rallies even as positive regulatory developments emerge. Despite these sell-offs, analysts from Glassnode argue that this behavior aligns with typical patterns seen among long-term investors during the concluding stages of bull markets, suggesting it is not indicative of a mass exodus. Notably, Bitcoin is not alone in its struggles, as Ethereum and Solana have also recorded declines of 7.95% and 28.3%, respectively, since the start of the year, while numerous altcoins have faced even steeper losses. Looking ahead, questions linger regarding the viability of the four-year cycle thesis, particularly given the increasing institutional support and regulatory frameworks now in place in the crypto landscape. Matt Hougan, chief investment officer at Bitwise, remains optimistic, suggesting a potential Bitcoin resurgence in 2026 driven by the “debasement trade” thesis and a broader trend toward increased adoption of stablecoins, tokenization, and decentralized finance. Hougan emphasized the soundness of the underlying fundamentals, pointing to a positive outlook for the sector in the longer term.
Author  Mitrade
Yesterday 03: 11
Bitcoin experienced a sharp decline this weekend, briefly erasing its 2025 gains and dipping below its year-opening value of $93,507. The cryptocurrency fell to a low of $93,029 on Sunday, representing a 25% drop from its all-time high in October. Although it has rebounded slightly to around $94,209, the pressures on the market remain significant. The downturn occurred despite the reopening of the U.S. government on Thursday, which many had hoped would provide essential support for crypto markets. This year initially appeared promising for cryptocurrencies, particularly after the inauguration of President Donald Trump, who has established the most pro-crypto administration thus far. However, ongoing political tensions—including Trump's tariff strategies and the recent government shutdown, lasting a historic 43 days—have contributed to several rapid price pullbacks for Bitcoin throughout the year. Market dynamics are also being influenced by Bitcoin whales—investors holding large amounts of Bitcoin—who have been offloading portions of their assets, consequently stalling price rallies even as positive regulatory developments emerge. Despite these sell-offs, analysts from Glassnode argue that this behavior aligns with typical patterns seen among long-term investors during the concluding stages of bull markets, suggesting it is not indicative of a mass exodus. Notably, Bitcoin is not alone in its struggles, as Ethereum and Solana have also recorded declines of 7.95% and 28.3%, respectively, since the start of the year, while numerous altcoins have faced even steeper losses. Looking ahead, questions linger regarding the viability of the four-year cycle thesis, particularly given the increasing institutional support and regulatory frameworks now in place in the crypto landscape. Matt Hougan, chief investment officer at Bitwise, remains optimistic, suggesting a potential Bitcoin resurgence in 2026 driven by the “debasement trade” thesis and a broader trend toward increased adoption of stablecoins, tokenization, and decentralized finance. Hougan emphasized the soundness of the underlying fundamentals, pointing to a positive outlook for the sector in the longer term.
placeholder
Gold Price Forecast: XAU/USD declines below $4,050 on USD strength and hawkish Fed comments Gold price (XAU/USD) extends the decline to around $4,030 during the early Asian session on Tuesday. The precious metal edges lower as traders dialed back expectations of a US interest rate cut next month.
Author  FXStreet
6 hours ago
Gold price (XAU/USD) extends the decline to around $4,030 during the early Asian session on Tuesday. The precious metal edges lower as traders dialed back expectations of a US interest rate cut next month.
goTop
quote