

Bitcoin sustains $57K despite August CPI report

Source Fxstreet
  • US August CPI data revealed a slight increase in the monthly inflation rate, rising by 0.2%.
  • The crypto market remained steady despite the inflation report, as predictions favor the possibility of a 25 bps rate cut.
  • Bitcoin has experienced sharp declines in trading activity among centralized exchanges, per Glassnode's monthly data.

The crypto market saw slight declines after the US monthly inflation data came in at a 0.2% increase on Wednesday. The steady prices suggest that investors are not panicking at the possibility of a 25 basis point (bps) rate cut as opposed to earlier anticipation of a 50 bps cut.

Crypto market unfazed by low inflation data

US Consumer Price Index (CPI) data for August came in lower than expected, declining 2.5% against July's 2.9% on a yearly basis. At the same time, the annual core CPI stood at 3.2%, matching expectations. Notably, monthly CPI data increased 0.2% while core CPI rose 0.3%, per FXStreet inflation data report on Wednesday.

The increase in the monthly CPI data suggests that the possibility of a 50 bps interest rate cut in September by the Federal Reserve (Fed) may not be forthcoming. According to @KobeissiLetter, the likelihood of a 50 bps rate cut dropped to 8% after the CPI data release, meaning a 25 bps cut is more likely. A 25 bps cut should not  positively impact risk assets like cryptocurrencies.

Despite the changes it brought, the CPI data has yet to have heavy effects on the crypto market as Bitcoin has held the $57K price steady in the past few hours. Hence, the Federal Open Market Committee (FOMC) meeting slated for September 18 may prove vital for the future of the crypto market.

Meanwhile, Glassnode's weekly report suggests that mining activity among Bitcoin miners shows their resilience despite declining revenues. The mining hashrate for Bitcoin is approaching all-time highs, just behind by 1%. The present number of hashes required to mine a block is 338k exahash, which, the report notes, is the second-largest difficulty in the asset's history.

However, traders aren't displaying similar convictions as Bitcoin exchange volume has steadily declined since July.
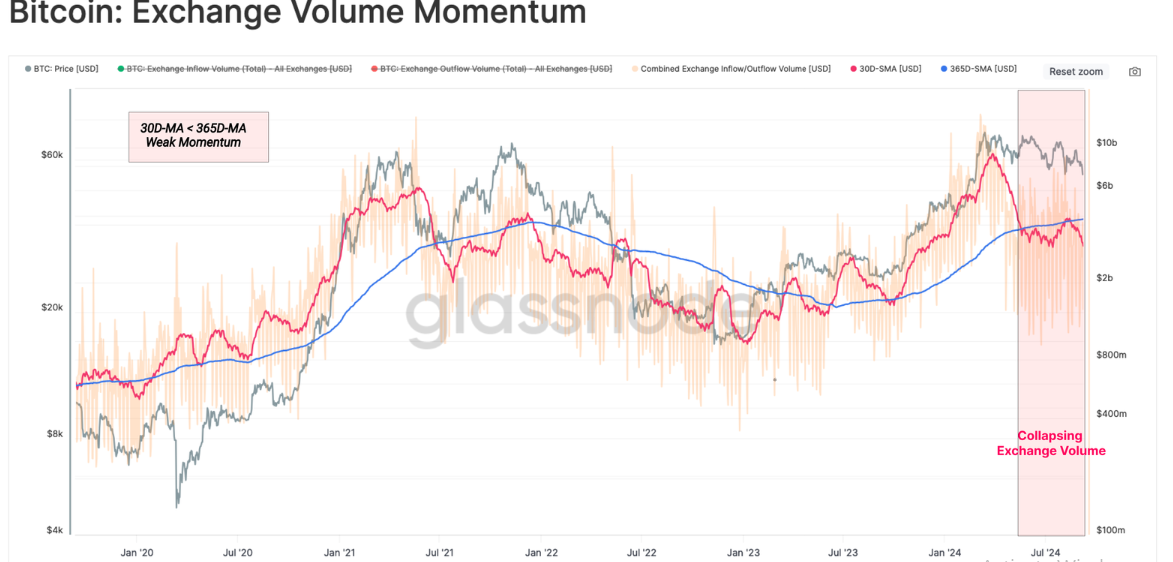
Bitcoin Exchange Volume Momentum

Bitcoin Exchange Volume Momentum

Notably, the exchange spot trading volume has fallen over the past 90 days, adding "more weight to the idea that there has been a notable decline in trade activity over the last quarter.

Furthermore, the CVD metric —a tool that measures the net balance between market buying and selling in a spot market — revealed that selling pressures have grown among investors over the last 90 days.

Disclaimer: For information purposes only. Past performance is not indicative of future results.
placeholder
China's factories are pricing in 5.7%. Its shoppers are pricing in 0.7%.China's October PPI rose 5.7% year on year, the fastest since June 2022, while CPI slowed to 0.7% and core CPI to 0.8%. Input prices rose faster than factory-gate prices, squeezing mid-stream margins by roughly five percentage points. The Hang Seng fell 0.13% on a day the S&P 500 rose 2.35%, the only major market to sit out the risk-on session.
Author  Irene Q.
Nov 10, Tue
China's October PPI rose 5.7% year on year, the fastest since June 2022, while CPI slowed to 0.7% and core CPI to 0.8%. Input prices rose faster than factory-gate prices, squeezing mid-stream margins by roughly five percentage points. The Hang Seng fell 0.13% on a day the S&P 500 rose 2.35%, the only major market to sit out the risk-on session.
placeholder
Gold Price Analysis Today | Forex Gold Analysis | XAU/USD Analysis - November 11, 2026Get the latest gold price analysis, forex gold insights, and XAU/USD analysis for November 11, 2026. Read on for the details.
Author  Mitrade
Nov 11, Wed
Get the latest gold price analysis, forex gold insights, and XAU/USD analysis for November 11, 2026. Read on for the details.
placeholder
Bitcoin lost its 200-day average — but the exit started three sessions before the CPIBitcoin fell 2.5% to about $73,400 on 11 November, an 11-week low, breaking its 200-day moving average near $73,100. The 24-hour liquidation tally reached $632 to $705 million, roughly 82% of it longs. But spot ETF outflows began three sessions earlier and USDT's market cap has shrunk $6.6 billion in 60 days — the leveraged length left before the inflation print did. A double top at 81,890 and 81,080 leaves a measured target of 69,366.
Author  Suzie
Nov 11, Wed
Bitcoin fell 2.5% to about $73,400 on 11 November, an 11-week low, breaking its 200-day moving average near $73,100. The 24-hour liquidation tally reached $632 to $705 million, roughly 82% of it longs. But spot ETF outflows began three sessions earlier and USDT's market cap has shrunk $6.6 billion in 60 days — the leveraged length left before the inflation print did. A double top at 81,890 and 81,080 leaves a measured target of 69,366.
placeholder
Gold Extends Slide Below $4,000 as Rising US Inflation, Fed December Hike Bets Pressure Prices On November 12, gold prices (XAUUSD) extended their recent losses, falling further below $4,000 in early Asian trading to hit an intraday low near $3,968, marking a third consecutive day
Author  TradingKey
Yesterday 02: 00
On November 12, gold prices (XAUUSD) extended their recent losses, falling further below $4,000 in early Asian trading to hit an intraday low near $3,968, marking a third consecutive day
placeholder
Gold closed below $4,000 again — the ETF crowd and central banks stayed, the momentum money leftSpot gold is trading near $3,999, its third consecutive lower daily low, after a 5.00% 10-year yield and a 102.85 dollar index raised the odds of a December hike to 87%. But the selling is not coming from the strategic holders: managed-money net longs fell to 324 tonnes, a 21-week low, and Goldman Sachs attributes roughly 95% of five weeks of selling to non-reportable positions. ETFs still hold a record 4,256 tonnes and central banks bought 321 tonnes in Q3. The table below sets the triggers, directions and levels.
Author  Irene Q.
Yesterday 03: 20
Spot gold is trading near $3,999, its third consecutive lower daily low, after a 5.00% 10-year yield and a 102.85 dollar index raised the odds of a December hike to 87%. But the selling is not coming from the strategic holders: managed-money net longs fell to 324 tonnes, a 21-week low, and Goldman Sachs attributes roughly 95% of five weeks of selling to non-reportable positions. ETFs still hold a record 4,256 tonnes and central banks bought 321 tonnes in Q3. The table below sets the triggers, directions and levels.
Related Instrument
goTop
quote