Bitcoin price downtrend likely capped, JPMorgan says, as profit-taking on GBTC largely concludes
- Bitcoin price has found support above the 100-day SMA after a 20% crash from January 11 peak.
- BTC could pivot at $39,457, push north as RSI rejects downside, ADX hints at strengthening correction.
- Invalidation of the positive postulation will occur upon lower low beneath Tuesday bottom at $38,555.
- JPMorgan says profit-taking on GBTC has largely concluded, expects limited downside for Bitcoin.
Bitcoin (BTC) price has been on a steep decline since January 11, when spot BTC exchange-traded funds (ETFs) started trading. The load-shedding exercise was provoked by news of Grayscale Bitcoin Trust (GBTC) redemptions, but things could change soon, according to investment bank JPMorgan.
Also Read: Bitcoin Price Outlook: Analyst anticipates $35,000 retest for BTC as part of ‘respectable’ correction
Bitcoin price to record limited further downside: JPMorgan
Investment firm JPMorgan says Bitcoin has limited further downside, a conclusion drawing from the assumption that profit-taking on GBTC has largely concluded.
The bank acknowledges that BTC market value has dwindled over 20% since spot BTC ETFs went live. The report on Thursday attributes the fall in Bitcoin price to profit-taking in GBTC by investors who had purchased the fund at a discount.
“Given $4.3b has come out already from GBTC, we conclude that GBTC profit taking has largely happened already,” wrote JPMorgan Managing Director Nikolaos Panigirtzoglou. “This would imply that most of the downward pressure on [B]itcoin from that channel should be largely behind us.”
Bitcoin price outlook as JPMorgan says BTC has bottomed out
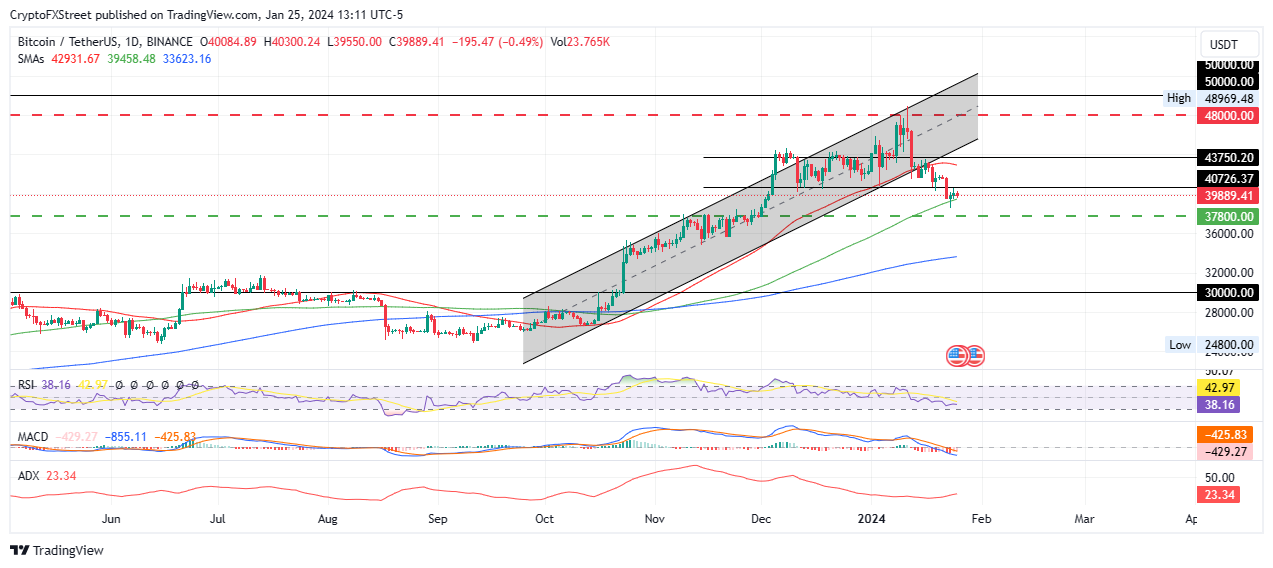
Since the Monday low of $39,431, Bitcoin price continues to sit on support due to the 100-day Simple Moving Average (SMA) at $39,458. The Relative Strength Index (RSI) suggests the bulls are resisting a further downtrend as it is moving horizontally.
Notwithstanding, the position of the RSI below the 50 midline is concerning as it points to low price strength. It shows the bears have the advantage, accentuated by the position of the Moving Average Convergence Divergence (MACD) below its signal line (orange band) in negative territory. These indicators reinforce the bearish outlook and are accentuated by the Awesome Oscillator (AO) in negative territory, evidence of bearish dominance in the BTC market.
Increased selling pressure could see Bitcoin price slip past the 100-day SMA at $39,458. Further south, it could extend to the $37,800 support, below which the drains would swing open for BTC to extend the fall toward the 200-day SMA at $33,623.
In a dire case, Bitcoin price could roll over to the $30,000 psychological level. Such a move would denote a 25% fall below current levels.

BTC/USDT 1-day chart
Conversely, should the 100-day SMA hold as support, Bitcoin price could turn north, going as high as to overcome the 50-day SMA at $ 42,931. It could also breach the $43,750 blockade before a foray into the ascending parallel channel.
In a highly bullish case, Bitcoin price could break past the resistance confluence between the midline of the channel and the $48,000 critical roadblock, bringing the $50,000 psychological level within focus, 25% above the current price.


