

ETFs, Whales, and Long-Term Holders Buy Bitcoin: Is the Bottom In?

Source Beincrypto

After weeks of turbulence, signs are emerging that Bitcoin might be approaching a crucial turning point.

US-listed Bitcoin exchange-traded funds (ETFs) posted net inflows of $28.7 million on September 9, marking a reversal after a prolonged outflow streak that saw $1.2 billion leave the market. This is the first net inflow since late August, coinciding with Bitcoin’s price rebound of 6%.

Bitcoin Buy Orders Get Filled, Signaling Local Bottom

The renewed inflows suggest growing interest among professional investors. While ETFs have suffered since August 27, the return of inflows could be an early indicator of shifting sentiment. September is traditionally bearish for Bitcoin, but this uptick in ETF demand provides a potential counterpoint.

“The net flow turned positive after 8 days of heavy outflows. Yesterday’s only outflows belonged to Grayscale (GBTC) and BlackRock (IBIT), the 2 largest US Bitcoin ETFs,” analysts at SpotOnChain said.
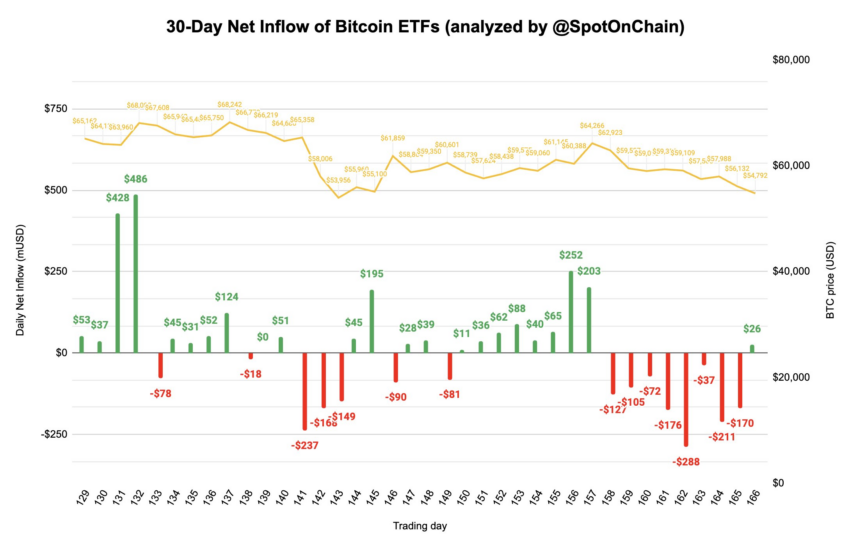
Bitcoin ETFs InflowsBitcoin ETFs Inflows. Source: SpotOnChain

Meanwhile, a prominent whale on Bitfinex has been aggressively buying Bitcoin, accumulating around 450 BTC daily. This move comes as Bitcoin’s price hovers below $60,000, a level at which the whale appears confident in the asset’s long-term potential.

Accumulation patterns on Bitfinex, where these trades are taking place, show a clear dominance in the order book, signaling a strong belief in Bitcoin’s resilience.
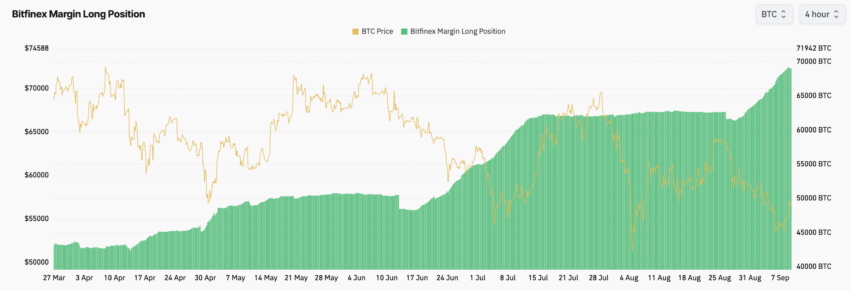
Bitfinex Margin Long PositionsBitfinex Margin Long Positions. Source: Coinglass

At the same time, long-term holders (LTH) are increasing their Bitcoin positions. Data reveals a net increase in LTH positions, historically a bullish signal. When long-term investors accumulate, it often indicates confidence in the cryptocurrency’s future growth potential.

The stability provided by LTH accumulation may help anchor Bitcoin’s price and set the stage for a rebound.
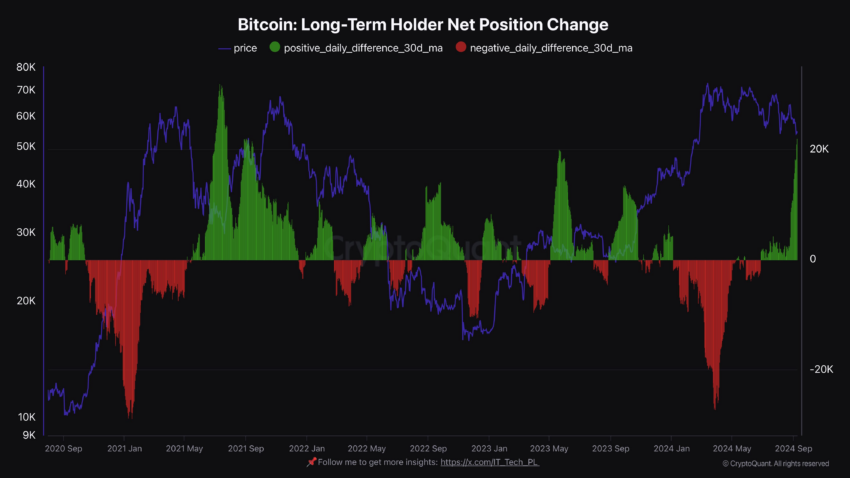
Bitcoin Long-Term Holders PositionsBitcoin Long-Term Holders Positions. Source: CryptoQuant

Despite the rising buying pressure, analysts at Bernstein and even seasoned trader Peter Brandt remain cautious. Brandt sees a 65% chance that Bitcoin could drop below $40,000 before reaching any new highs. Brandt’s technical analysis places probabilities of Bitcoin hitting $80,000 at 20% and surging to $130,000 by September 2025 at 15%.

Meanwhile, Bernstein analyst Gautam Chhugani said that the election outcome, whether Donald Trump or Kamala Harris prevails, could significantly impact Bitcoin’s future course.

“We expect the delta between the two political outcomes to be wide. We expect Bitcoin to claim back new highs, in case of a Trump win and by Q4, we expect Bitcoin to reach close to $80,000-$90,000 range. However, if Harris wins, we expect Bitcoin to break the current floor around $50,000 and test the $30,000-$40,000 range,” Chhugani explained.

Read more: Bitcoin (BTC) Price Prediction 2024/2025/2030

As ETFs, whales, and LTHs continue to accumulate, the market watches closely for any signs that Bitcoin may be near its bottom. For now, uncertainty lingers, but the growing buying pressure suggests optimism is brewing.

Disclaimer: For information purposes only. Past performance is not indicative of future results.
placeholder
China's factories are pricing in 5.7%. Its shoppers are pricing in 0.7%.China's October PPI rose 5.7% year on year, the fastest since June 2022, while CPI slowed to 0.7% and core CPI to 0.8%. Input prices rose faster than factory-gate prices, squeezing mid-stream margins by roughly five percentage points. The Hang Seng fell 0.13% on a day the S&P 500 rose 2.35%, the only major market to sit out the risk-on session.
Author  Irene Q.
Nov 10, Tue
China's October PPI rose 5.7% year on year, the fastest since June 2022, while CPI slowed to 0.7% and core CPI to 0.8%. Input prices rose faster than factory-gate prices, squeezing mid-stream margins by roughly five percentage points. The Hang Seng fell 0.13% on a day the S&P 500 rose 2.35%, the only major market to sit out the risk-on session.
placeholder
Gold Price Analysis Today | Forex Gold Analysis | XAU/USD Analysis - November 11, 2026Get the latest gold price analysis, forex gold insights, and XAU/USD analysis for November 11, 2026. Read on for the details.
Author  Mitrade
Nov 11, Wed
Get the latest gold price analysis, forex gold insights, and XAU/USD analysis for November 11, 2026. Read on for the details.
placeholder
Gold Extends Slide Below $4,000 as Rising US Inflation, Fed December Hike Bets Pressure Prices On November 12, gold prices (XAUUSD) extended their recent losses, falling further below $4,000 in early Asian trading to hit an intraday low near $3,968, marking a third consecutive day
Author  TradingKey
Yesterday 02: 00
On November 12, gold prices (XAUUSD) extended their recent losses, falling further below $4,000 in early Asian trading to hit an intraday low near $3,968, marking a third consecutive day
placeholder
Gold closed below $4,000 again — the ETF crowd and central banks stayed, the momentum money leftSpot gold is trading near $3,999, its third consecutive lower daily low, after a 5.00% 10-year yield and a 102.85 dollar index raised the odds of a December hike to 87%. But the selling is not coming from the strategic holders: managed-money net longs fell to 324 tonnes, a 21-week low, and Goldman Sachs attributes roughly 95% of five weeks of selling to non-reportable positions. ETFs still hold a record 4,256 tonnes and central banks bought 321 tonnes in Q3. The table below sets the triggers, directions and levels.
Author  Irene Q.
Yesterday 03: 20
Spot gold is trading near $3,999, its third consecutive lower daily low, after a 5.00% 10-year yield and a 102.85 dollar index raised the odds of a December hike to 87%. But the selling is not coming from the strategic holders: managed-money net longs fell to 324 tonnes, a 21-week low, and Goldman Sachs attributes roughly 95% of five weeks of selling to non-reportable positions. ETFs still hold a record 4,256 tonnes and central banks bought 321 tonnes in Q3. The table below sets the triggers, directions and levels.
placeholder
US October PPI Preview: Fed Rate Hike Expectations Rise, PPI May Be Key Variable; How Will US Stocks, Dollar, and Gold Move?On Friday (Nov. 13) Eastern Time, the U.S. will release the October Producer Price Index (PPI). Following the October CPI once again exceeding expectations, the market will look to the PP
Author  TradingKey
Yesterday 08: 36
On Friday (Nov. 13) Eastern Time, the U.S. will release the October Producer Price Index (PPI). Following the October CPI once again exceeding expectations, the market will look to the PP
goTop
quote