

Crypto products bleed $305 million as economic data stirs negative sentiment
- Digital asset products witnessed net outflows totaling $305 million after a previous week of high inflows.
- Bitcoin recorded the highest outflows, shedding $318 million as expectations of the Fed cutting interest rates by September declined.
- Ethereum products also saw outflows of $5.7 million, while Solana saw inflows of $7.6 million.
Crypto investment products witnessed a setback last week, recording net outflows of $305 million as August came to a close. According to CoinShares' weekly report on Monday, the majority of outflows stemmed from Bitcoin ETF investors, showing the asset's sensitivity to interest rate cuts.
Crypto products end last week of August with $305 million outflows
The crypto investment landscape flipped to net outflows last week, reaching $305 million after a previous week of inflows, according to CoinShares' weekly report. CoinShares stated that the outflows are largely a result of a general negative sentiment across crypto investment providers and regions.
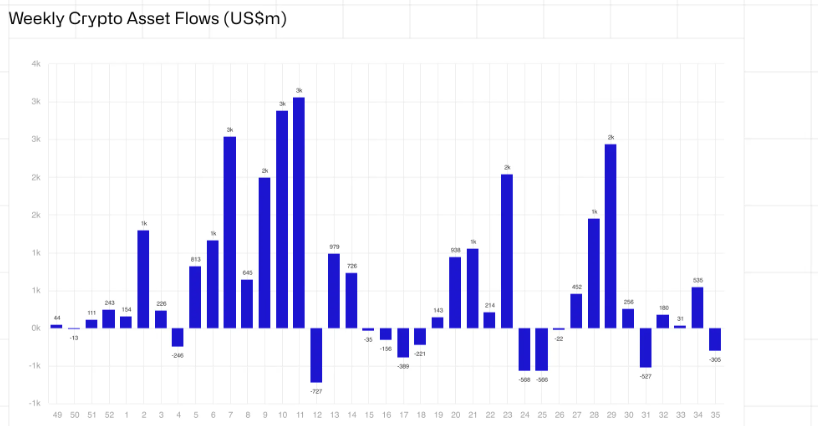
Weekly Crypto Asset Flows
On the geographical plane, the US had the highest share of outflows, totaling $318 million. The high outflows may have resulted from "stronger-than-expected" macroeconomic data, which lowered the possibility of the Federal Reserve (Fed) cutting interest rates by 50 basis points in September.
Germany and Sweden also recorded outflows of $7.3 million and $4.3 million, respectively. However, Canada and Switzerland saw positive flows despite the general negativity, recording $13.2 million and $5.5 million in inflows, respectively. Hong Kong, Australia and Brazil also witnessed slight inflows last week.
Bitcoin ETFs were hit the hardest among asset classes, recording outflows of $319 million. The sudden outflows may result from Bitcoin's sensitivity to interest rate cuts. It also aligns with BTC's recent price decline, which dropped below $59K on Friday.
The price decline has attracted whales who have been withdrawing from exchanges in the past few days. Lookonchain data revealed earlier on Monday that a large whale wallet withdrew 1,100 BTC worth $64.26 million from Binance.
A whale wallet withdrew 1,100 $BTC($64.26M) from #Binance 21 mins ago.
— Lookonchain (@lookonchain) September 2, 2024
Address:
1KuPikhUYtHz3fmSQ2UvotpUuN672NuEcm pic.twitter.com/KDBSYfkiZK
Amid Bitcoin ETF outflows, short Bitcoin ETF investment products recorded inflows for the second week in a row, totaling $4.4 million. The inflows were the highest the product has seen since March, indicating bearish investors are becoming active.
Meanwhile, Ethereum ETFs witnessed outflows of $5.7 million last week, stretching its outflow record to a third consecutive week. On the other hand, Solana investment products saw inflows totaling $7.6 million.
Bitcoin, altcoins, stablecoins FAQs
Bitcoin is the largest cryptocurrency by market capitalization, a virtual currency designed to serve as money. This form of payment cannot be controlled by any one person, group, or entity, which eliminates the need for third-party participation during financial transactions.
Altcoins are any cryptocurrency apart from Bitcoin, but some also regard Ethereum as a non-altcoin because it is from these two cryptocurrencies that forking happens. If this is true, then Litecoin is the first altcoin, forked from the Bitcoin protocol and, therefore, an “improved” version of it.
Stablecoins are cryptocurrencies designed to have a stable price, with their value backed by a reserve of the asset it represents. To achieve this, the value of any one stablecoin is pegged to a commodity or financial instrument, such as the US Dollar (USD), with its supply regulated by an algorithm or demand. The main goal of stablecoins is to provide an on/off-ramp for investors willing to trade and invest in cryptocurrencies. Stablecoins also allow investors to store value since cryptocurrencies, in general, are subject to volatility.
Bitcoin dominance is the ratio of Bitcoin's market capitalization to the total market capitalization of all cryptocurrencies combined. It provides a clear picture of Bitcoin’s interest among investors. A high BTC dominance typically happens before and during a bull run, in which investors resort to investing in relatively stable and high market capitalization cryptocurrency like Bitcoin. A drop in BTC dominance usually means that investors are moving their capital and/or profits to altcoins in a quest for higher returns, which usually triggers an explosion of altcoin rallies.
Recommended Articles


