

Bitcoin recovers from last week's slump, but downside bias persists
- Bitcoin rises 2% on Monday after losing more than 10% in the past week.
- CryptoQuant's Bitcoin Coinbase Premium Index is falling, suggesting a decrease in investors' interest and activity in Coinbase.
- US spot Bitcoin ETFs registered outflows last week, and a whale wallet deposited BTC worth more than $240 million in Binance.
- Historically, September hasn’t been a good month for Bitcoin, but the fourth quarter as a whole tends to end with gains.
Bitcoin (BTC) recovers slightly on Monday after falling 11% last week and closing below $57,500, weighed by declining demand from US spot Bitcoin ETFs, which recorded $279.4 million in outflows. Additionally, a whale has deposited a large amount of BTC in Binance, and decreasing investors' interest and activity in Coinbase suggests that Bitcoin's rebound could be short-lived at the start of a month that historically hasn’t been positive for prices.
Daily digest market movers: Few signs of optimism
- CryptoQuant's Bitcoin Coinbase Premium Index, a key indicator of how large-wallet investors behave, suggests decreasing interest from whales in the top crypto. The indicator shows the gap between Coinbase Pro price (USD pair) and Binance price (USDT pair). Coinbase Premium data is one of the indicators that shows a sign of whale accumulation, as the Coinbase Pro platform is considered the gateway for institutional investors to purchase cryptocurrencies.
In the case of Bitcoin, the index fell from 0.077 to -0.004 from August 24 to September 1, trading below its 14-day Simple Moving Average (SMA) at 0.018. This indicates that whales are continuously selling at a lower premium. In addition, it shows a decrease in the interest and activeness of investors in Coinbase.
-638608815451595561.png)
Bitcoin Coinbase Premium Index chart
- According to Lookonchain data, a whale deposited 4,164 BTC worth $243.8 million in Binance exchange from Saturday to Monday. BTC fell 3% over the weekend.
This whale deposited 4,164 $BTC($243.8M) to #Binance in the past 3 days.https://t.co/vdx96ZrFRH pic.twitter.com/N1j8LHqJ3D
— Lookonchain (@lookonchain) September 2, 2024
- US spot Bitcoin ETFs recorded a total net outflow of $279.4 million last week, according to Coinglass data, a sign of waning market sentiment. The combined Bitcoin reserves held by the 11 US spot Bitcoin ETFs stand at $43.62 billion.
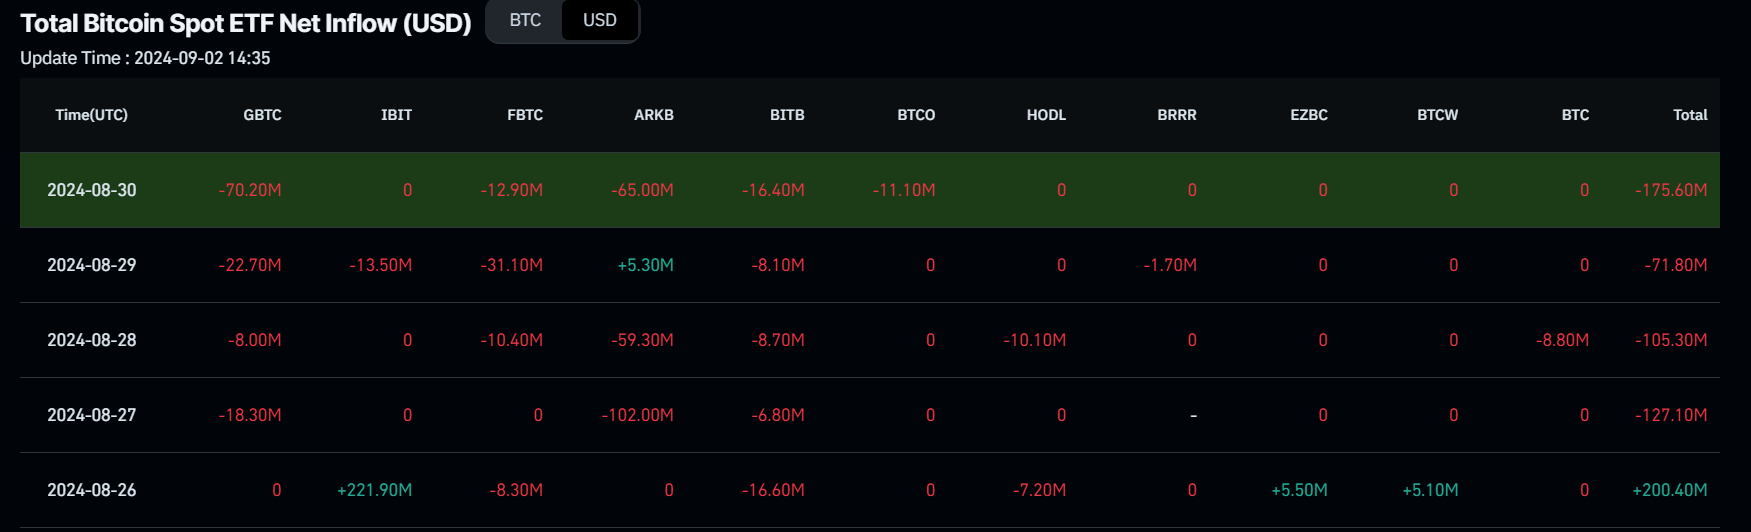
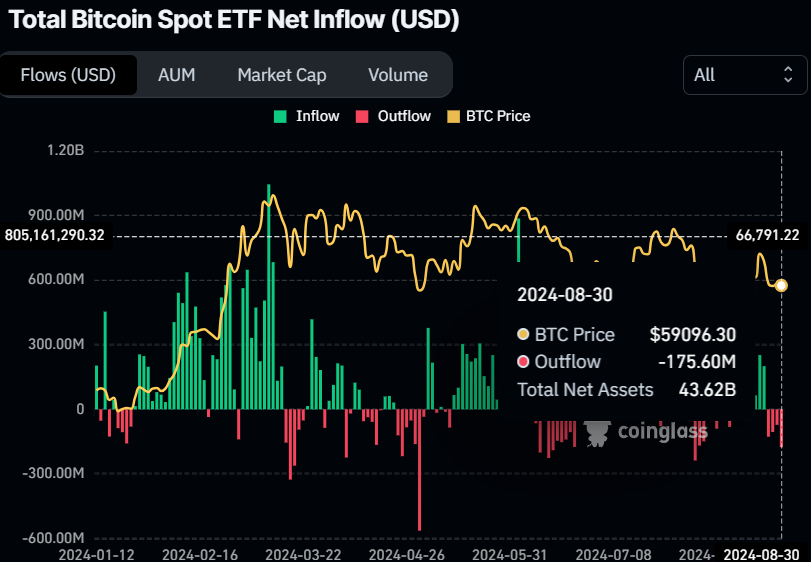
Bitcoin Spot ETF Net Inflow data
- Coinglass's Historical Bitcoin Monthly Return (%) data shows how Bitcoin has performed in different monthly percentages. As shown in the graph below, Bitcoin generally yielded negative returns for traders in September, with an average of -4.45%. However, the fourth quarter (Q4) data has generally shown a positive trend, with an average of +88.84%. Q4 will be important for the largest cryptocurrency because the upcoming US elections in November, with favorable conditions, could propel the price of Bitcoin.
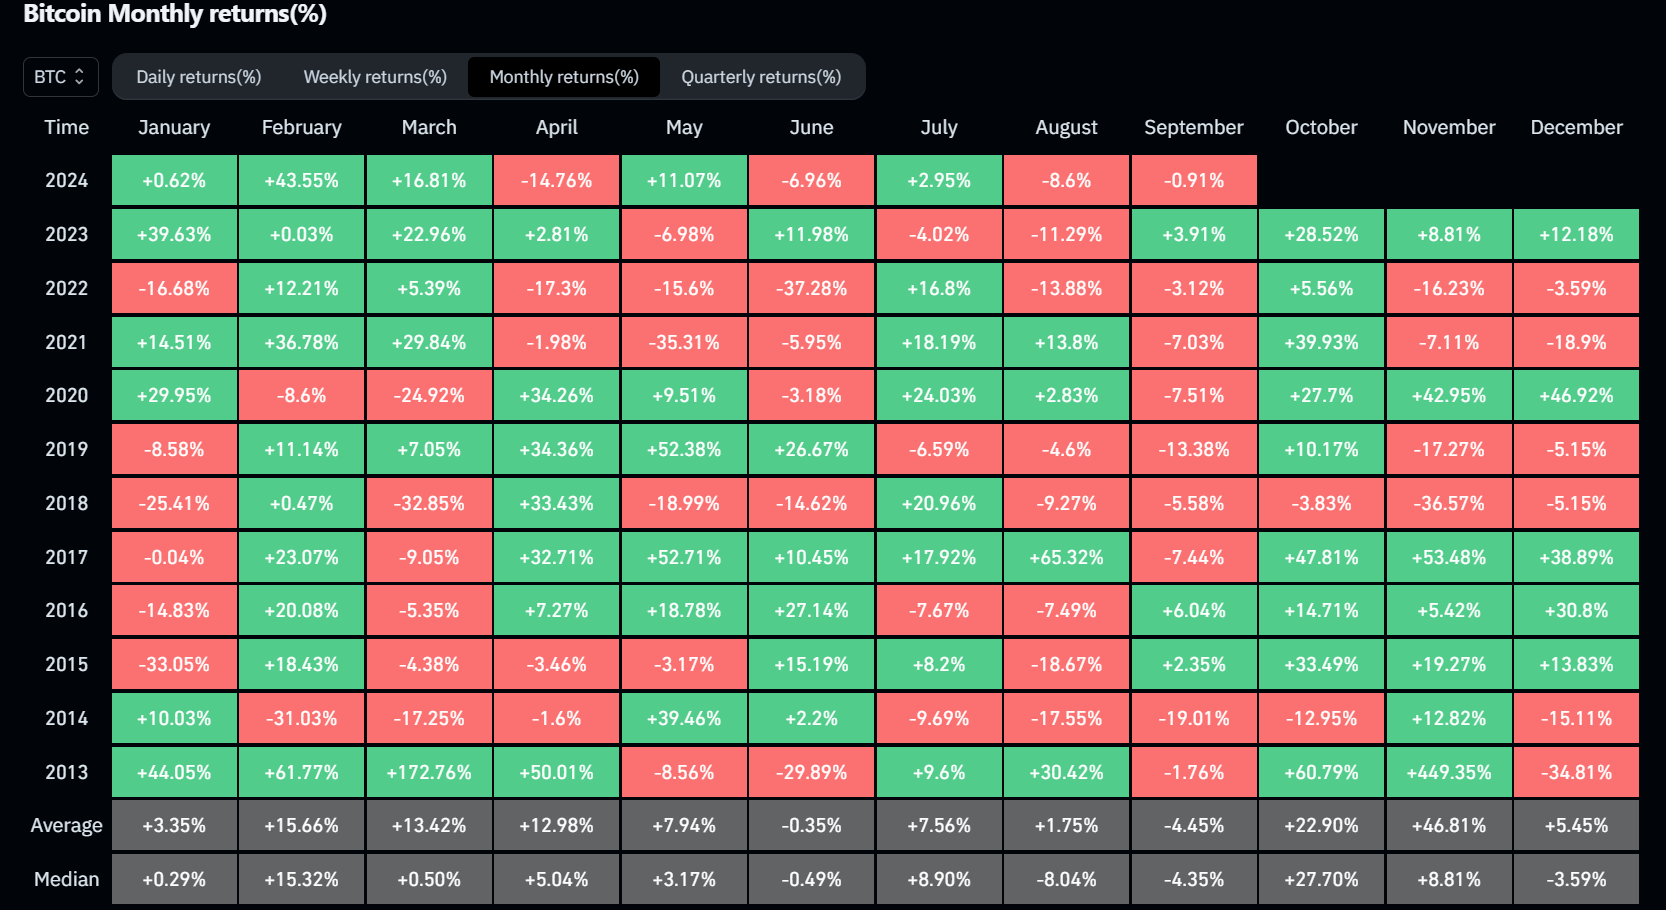
Bitcoin Monthly returns (%) chart
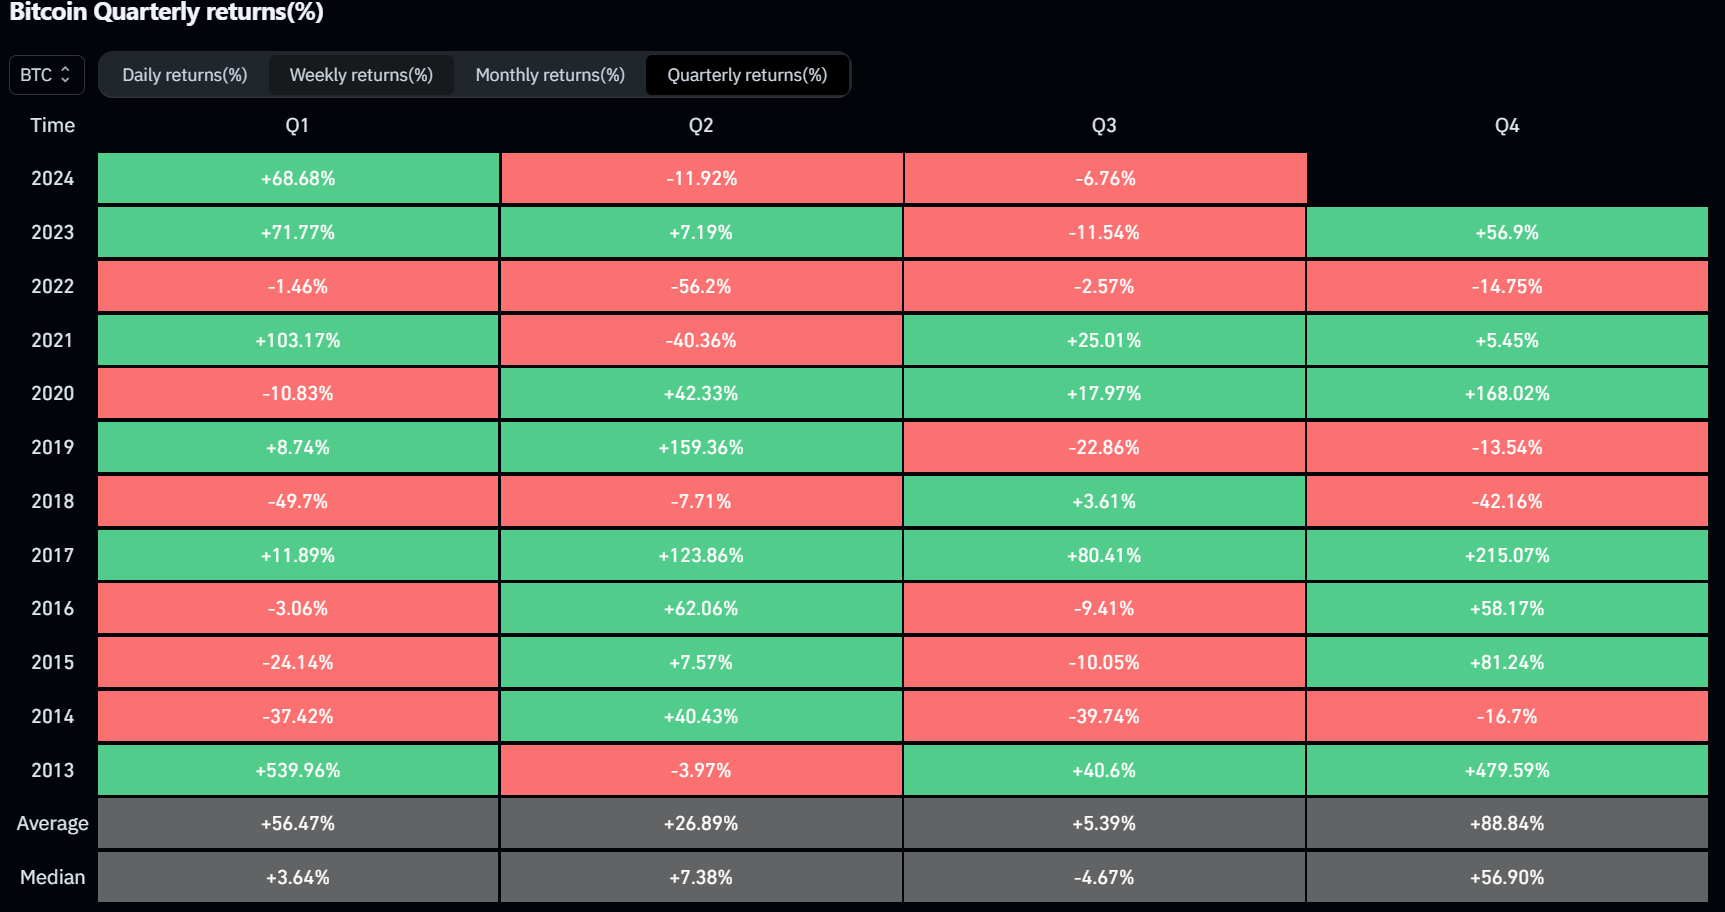
Bitcoin Quarterly returns (%) chart
Technical analysis: BTC closes below the support level
Bitcoin price closed below the $58,783 support level on Sunday and made a low of $57,201. On Monday, it trades slightly higher by 2% at $58,435.
If the 50% price retracement level at $59,560 (drawn from a high in late July to a low in early August) holds as resistance, Bitcoin could decline 4% from its current trading level at $58,435 to retest its daily support level at $56,000.
The Relative Strength Index (RSI) and the Awesome Oscillator (AO) on the daily chart trade below their neutral levels of 50 and zero, respectively. Both indicators suggest that neither bulls nor bears are in control.
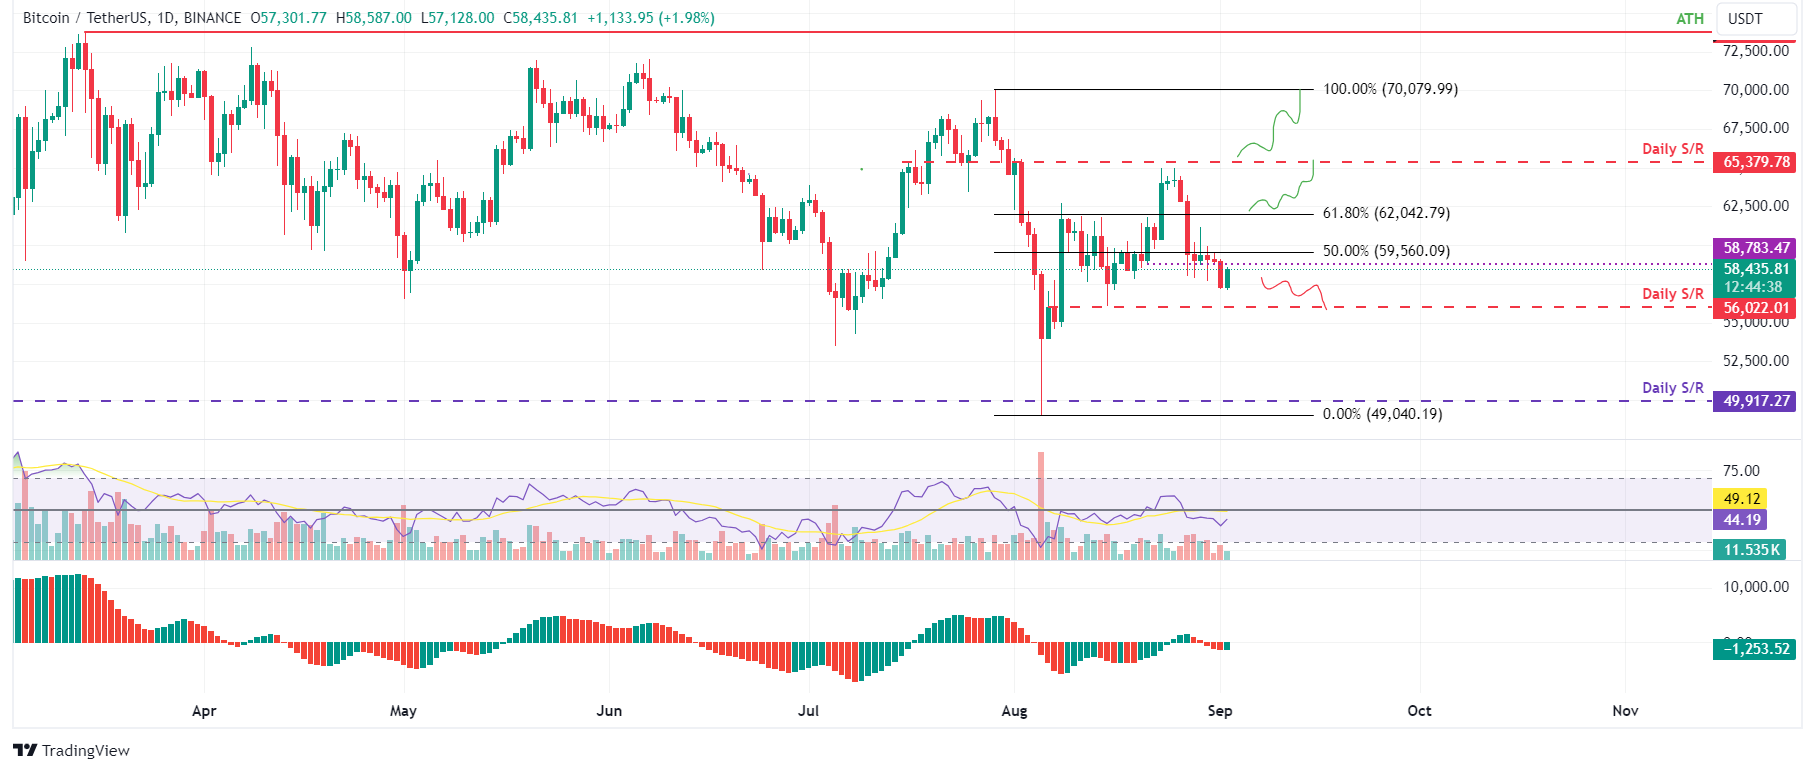
BTC/USDT daily chart
In an upside scenario, Bitcoin's price could break above the $59,560 resistance and close above $62,042, its 61.8% Fibonacci retracement level. In that case, the bearish thesis will be invalidated, and BTC could rise by 5.5% to revisit its daily resistance level at $65,379.
Bitcoin, altcoins, stablecoins FAQs
Bitcoin is the largest cryptocurrency by market capitalization, a virtual currency designed to serve as money. This form of payment cannot be controlled by any one person, group, or entity, which eliminates the need for third-party participation during financial transactions.
Altcoins are any cryptocurrency apart from Bitcoin, but some also regard Ethereum as a non-altcoin because it is from these two cryptocurrencies that forking happens. If this is true, then Litecoin is the first altcoin, forked from the Bitcoin protocol and, therefore, an “improved” version of it.
Stablecoins are cryptocurrencies designed to have a stable price, with their value backed by a reserve of the asset it represents. To achieve this, the value of any one stablecoin is pegged to a commodity or financial instrument, such as the US Dollar (USD), with its supply regulated by an algorithm or demand. The main goal of stablecoins is to provide an on/off-ramp for investors willing to trade and invest in cryptocurrencies. Stablecoins also allow investors to store value since cryptocurrencies, in general, are subject to volatility.
Bitcoin dominance is the ratio of Bitcoin's market capitalization to the total market capitalization of all cryptocurrencies combined. It provides a clear picture of Bitcoin’s interest among investors. A high BTC dominance typically happens before and during a bull run, in which investors resort to investing in relatively stable and high market capitalization cryptocurrency like Bitcoin. A drop in BTC dominance usually means that investors are moving their capital and/or profits to altcoins in a quest for higher returns, which usually triggers an explosion of altcoin rallies.
Recommended Articles


