

Chainlink Price Prediction: Investor interest in LINK collapses amid consolidation
- Chainlink price continues its three-month consolidation inside the $16.60 to $12.87 range.
- Declining volume and momentum hints at a potential correction but the outlook remains reliant on Bitcoin.
- A decisive three-day candlestick close below $12.87 will confirm the start of a corrective phase.
- On the other hand, a flip of the range high at $16.60 will indicate the continuation of the uptrend.
Chainlink (LINK) price has been moving sideways for nearly three months with no signs of directional bias. But the momentum has been on a decline for the duration of the sideways movement, which suggests a potential correction.
Read more: Chainlink price gains could extend riding on bullish on-chain metrics
Chainlink price consolidates without directional bias
Chainlink price rose 125% in just three weeks October 19, 2023 and November 9, 2023, and set up a local top at $16.60. Immediately after that LINK retraced 22%, creating the lower limit of the range at $12.87. Since then, the oracle token has swept the range high twice and the last retest on January 19, led to an 18% correction, where the altcoin currently trades at $14.19.
While the outlook for the crypto market is still bullish, the recent move in Bitcoin (BTC) price has investors questioning if the local top is in.
There are two outlooks for Chainlink price and both of them are contingent on Bitcoin price.
- If BTC continues to rally, then Chainlink price is likely going to sweep the range low at $12.87 and resume its uptrend.
- However, if BTC slides toward the $35,000 region, LINK could slide to the midpoint of its 125% rally at $11.90.
Considering the declining volume and the Relative Strength Index (RSI), the outlook remains bearish. The three-day RSI is bouncing off the 50 mean level, but if it slides below the midpoint, it could trigger 16% correction to $11.90.
The Awesome Oscillator (AO) flipping below the 0 mean level will be a secondary confirmation to the start of the downtrend.
Read more: Chainlink faces one hurdle on path to $20, on-chain metrics signal price rally
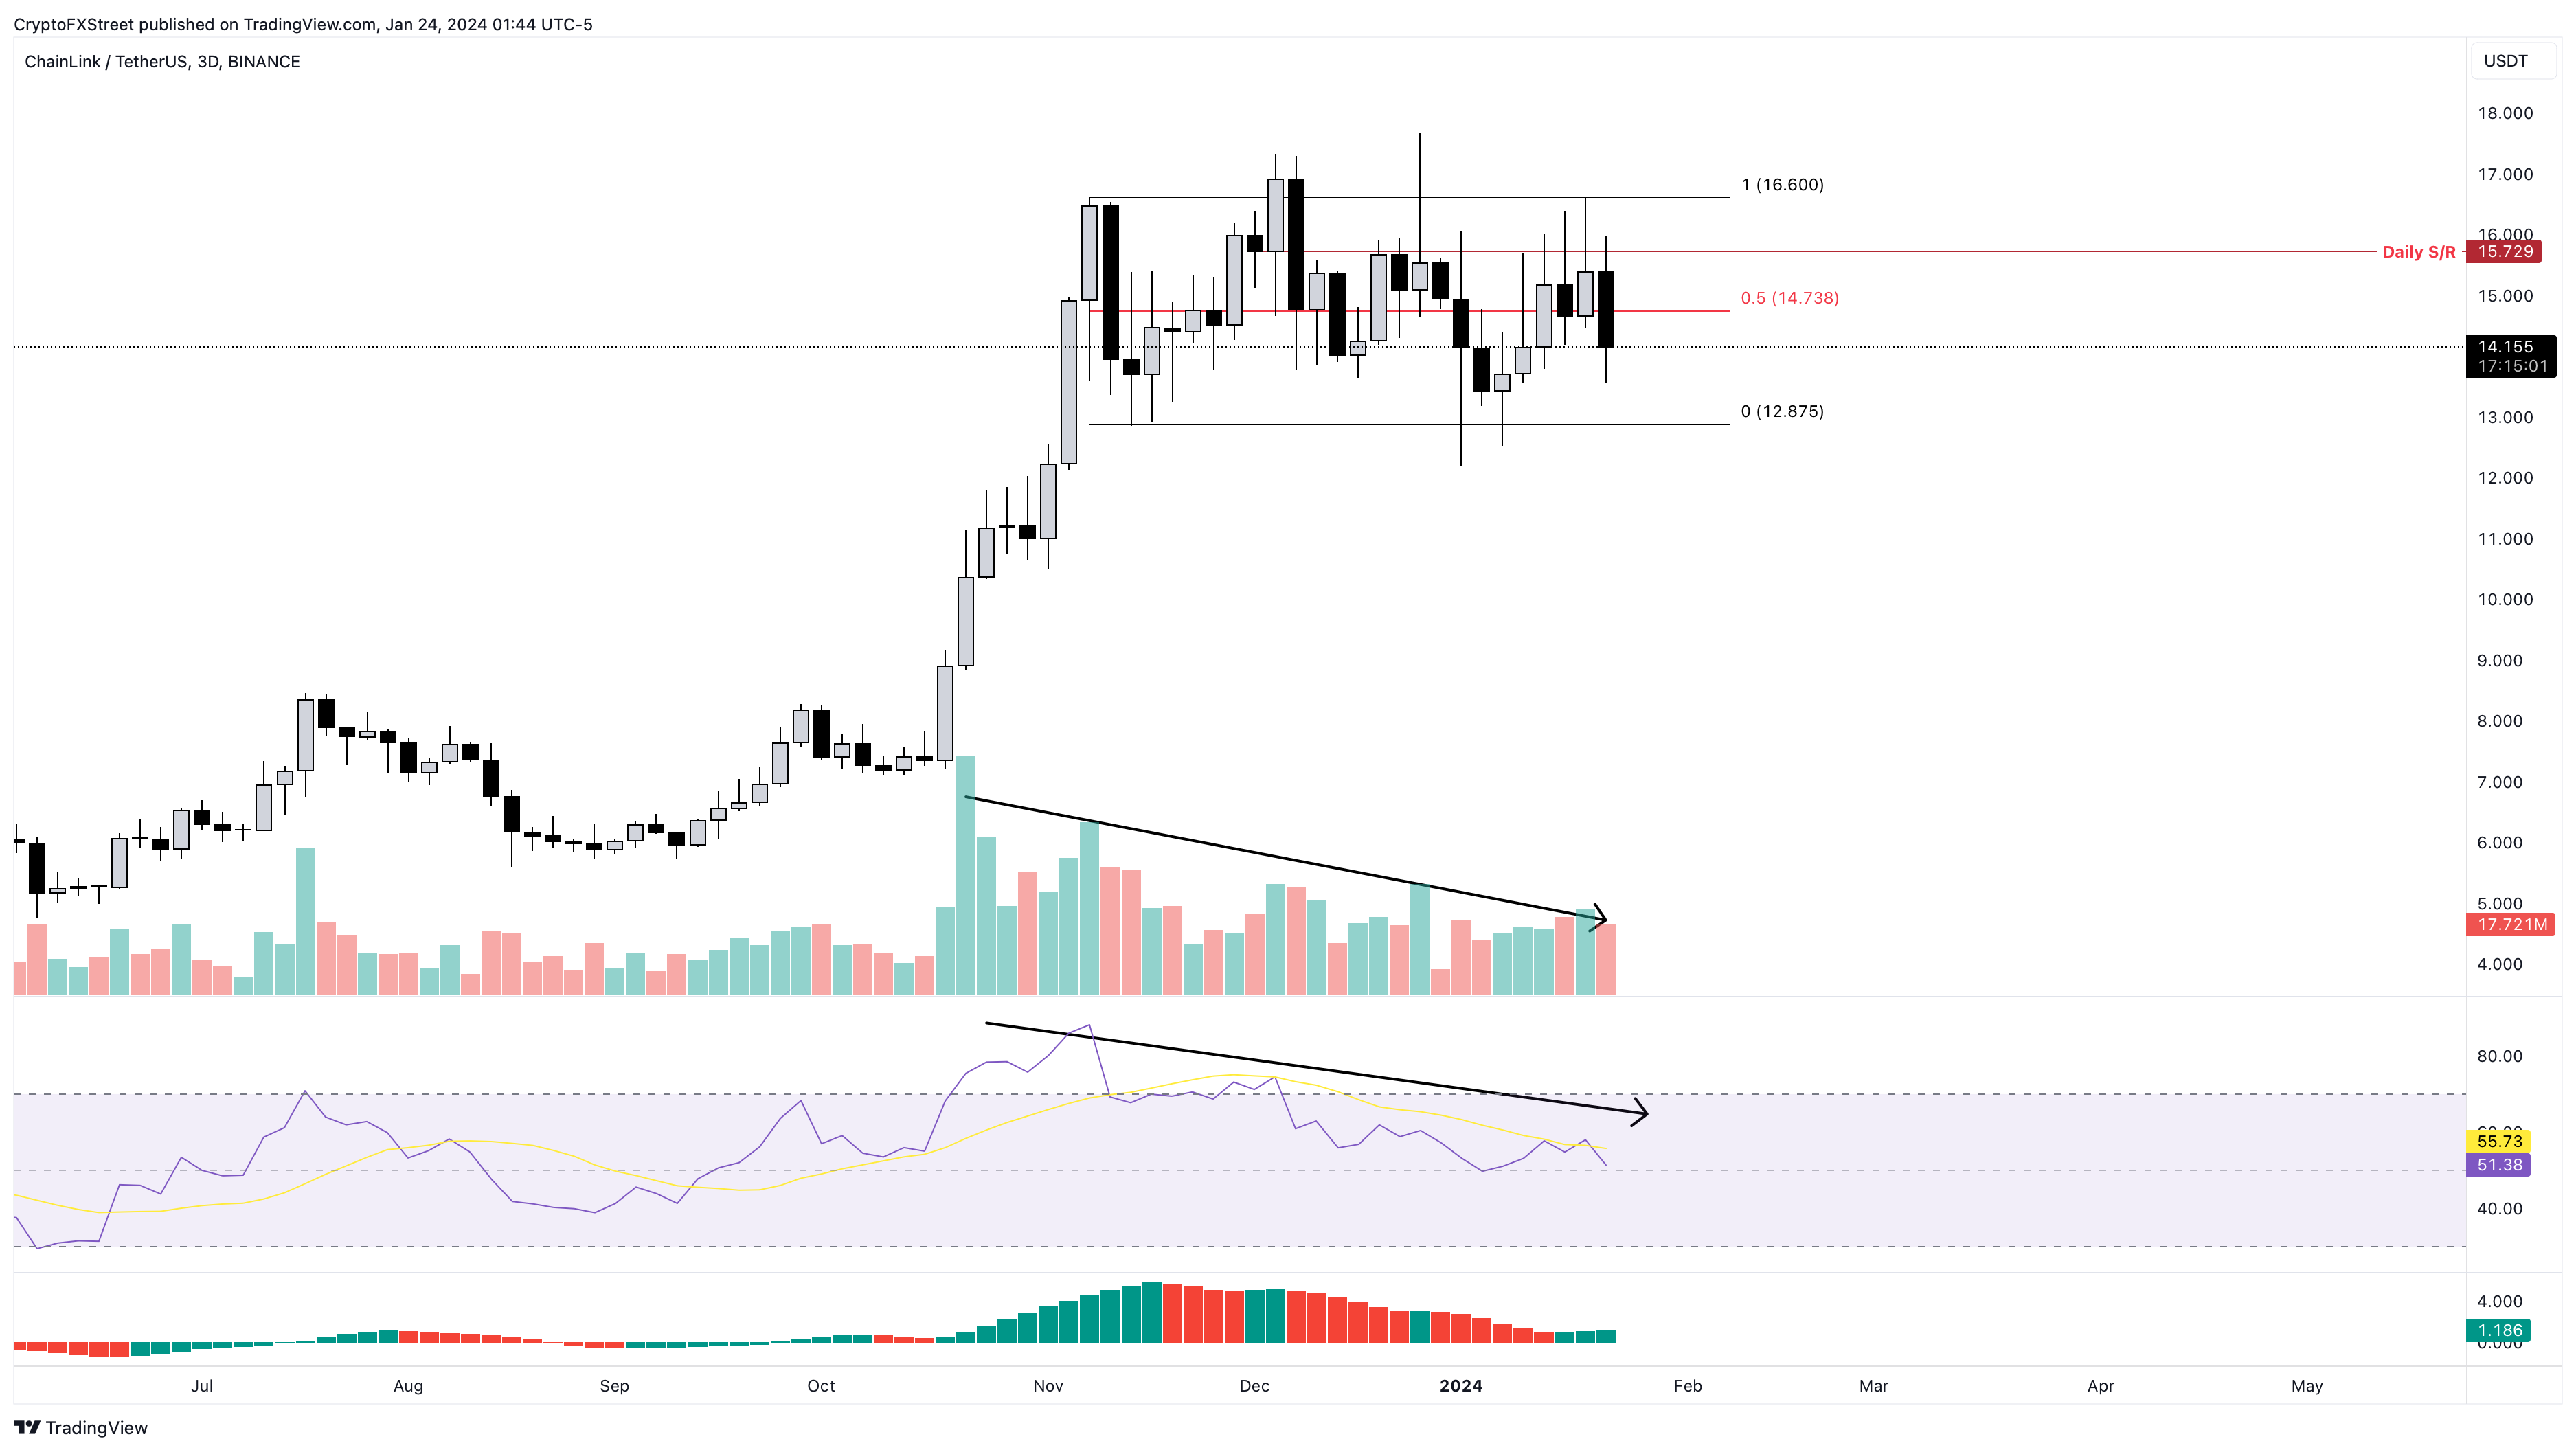
LINK/USDT 3-day chart
Also read: Week Ahead: This week’s altcoin narrative and Bitcoin's fourth halving targets
On-chain metrics suggest declining interest
Santiment’s on-chain data shows the Active Addresses metric for Chainlink has seen a steep correction since it slipped into decline in November 2023. The number of 24-hour Active Addresses has dropped from roughly 9,700 to 4,000 in under three months. Additionally, the on-chain Volume has also tanked from 1.60 billion to 0.60 billion in under three months.
%20[09.41.35,%2024%20Jan,%202024]-638416815938989469.png)
LINK Active Addresses, Volume
Furthermore, the same trend can be observed in Santiment’s Network Growth metric, which tracks the number of new addresses joining the Chainlink network. This indicator shows a fall from 3,000 to 1,100 in under three months.
%20[13.27.26,%2024%20Jan,%202024]-638416816336754140.png)
LINK Network Growth
All in all, the on-chain metric shows that the interest in LINK has dropped since it slipped into consolidation, which increases the risk of a potential sell-off, especially if supported by a decline in Bitcoin price.
Recommended Articles


