AAVE price poised for a rally as on-chain data shows positive bias

Source Fxstreet
  • Coinglass open interest is rising and is at its highest this year, indicating an influx of new money.
  • Santiment daily active addresses are rising, signaling a bullish move.
  • Investors should be cautious about spikes in the Network Realized Profit/Loss metric.


AAVE (AAVE) has surged 15% since Monday and is maintaining its upward momentum with a 3.5% increase to $133.42 for the third straight day on Wednesday. On-chain data shows that AAVE's open interest data and daily active addresses are rising, signaling the continuation of the bullish trend.


AAVE price gains traction as on-chain data suggests a positive trend

Data from CoinGlass shows that the futures' Open Interest (OI) in AAVE at exchanges is also increasing. The OI indicates the total number of outstanding derivative contracts that have not been settled (offset by delivery) and whether money flows into the contract are increasing or decreasing.


Increasing OI represents new or additional money entering the market and new buying, which suggests a bullish trend. When OI decreases, it is usually a sign that the market is liquidating, more investors are leaving, and the current price trend is ending.


The graph below shows that AAVE's OI increased from $106.24 million on Monday to $177.55 million on Wednesday, the highest OI since the start of this year. This indicates that new or additional money is entering the market and new buying is occurring.
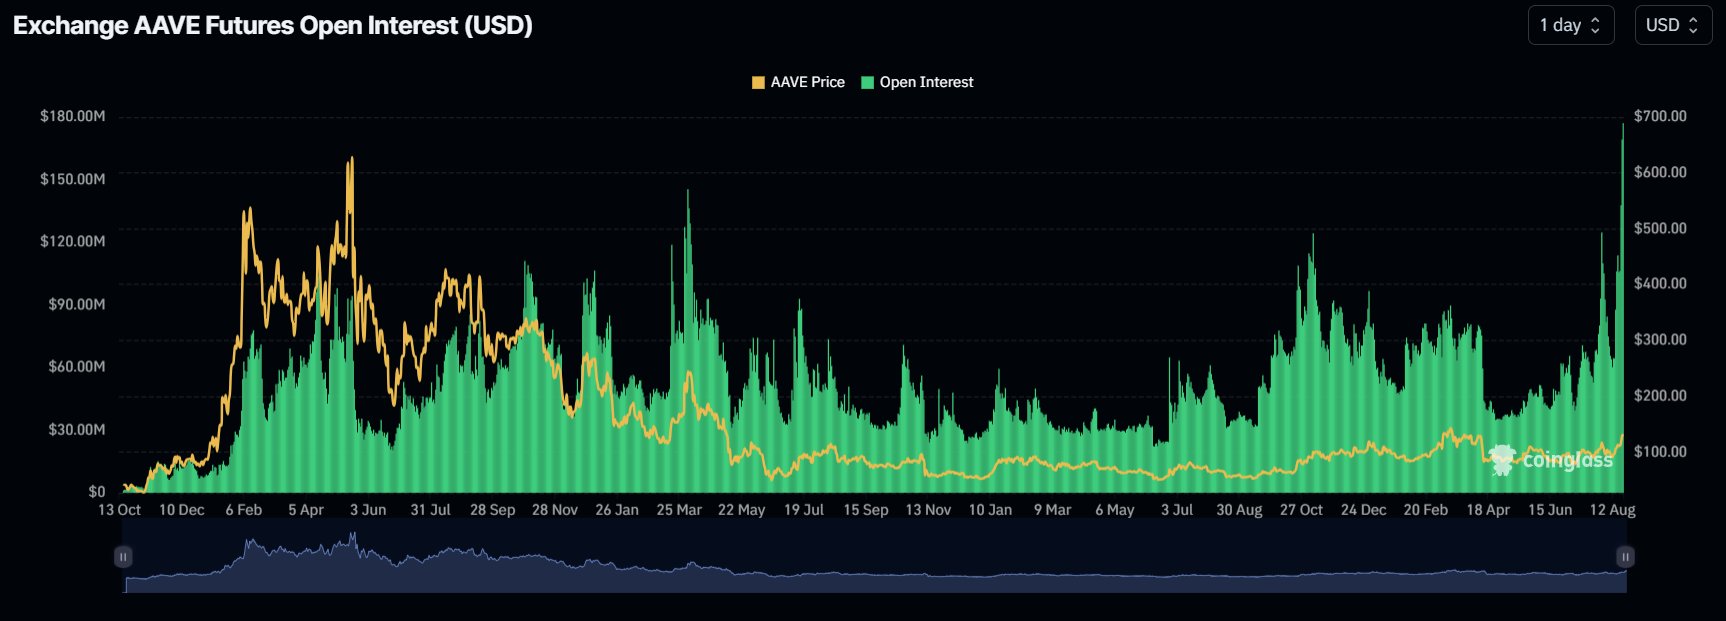
AAVE Open Interest chart

AAVE Open Interest chart

Santiment's Daily Active Addresses index helps to track network activity over time. A rise in the metric signals greater blockchain usage, while declining addresses point to lower demand for the network.


In AAVE's case, Daily Active Addresses have risen by 65% from Monday to Wednesday. This rise is the highest since the end of December 2023 and indicates that demand for AAVE's blockchain usage is increasing, which could propel a rally in AAVE's price.

AAVE Daily Active Addresses chart

AAVE Daily Active Addresses chart

Additionally, Coinglass's long-to-short ratio stands at 51.06%. This ratio suggests a bullish sentiment in the market, as the number above 50% suggests that more trades anticipate that the price of AAVE will rise.

AAVE long-to-short ratio chart

AAVE long-to-short ratio chart

Despite new buying, greater blockchain usage, and increasing bullish sentiment, AAVE's Network Realized Profit/Loss metric shows an upward spike. This indicates that its holders are, on average, selling their holdings at a significant profit. Consequently, investors should not anticipate an immediate price rally for the token.

AAVE Network Realized Profit/Loss chart

AAVE Network Realized Profit/Loss chart

Disclaimer: For information purposes only. Past performance is not indicative of future results.
placeholder
Gold Price Forecast: XAU/USD declines below $4,050 on USD strength and hawkish Fed comments Gold price (XAU/USD) extends the decline to around $4,030 during the early Asian session on Tuesday. The precious metal edges lower as traders dialed back expectations of a US interest rate cut next month.
Author  FXStreet
Nov 18, Tue
Gold price (XAU/USD) extends the decline to around $4,030 during the early Asian session on Tuesday. The precious metal edges lower as traders dialed back expectations of a US interest rate cut next month.
placeholder
Top 3 Price Prediction: Bitcoin, Ethereum, Ripple – BTC, ETH and XRP Look for a Foothold After a Sharp ShakeoutBitcoin trades near $92,600 after a dip below $90,000, while Ethereum around $3,118 and XRP near $2.21–$2.23 sit on key support zones, as BTC, ETH and XRP all try to turn a sharp correction into a tradable rebound rather than a deeper slide.
Author  Mitrade
Nov 19, Wed
Bitcoin trades near $92,600 after a dip below $90,000, while Ethereum around $3,118 and XRP near $2.21–$2.23 sit on key support zones, as BTC, ETH and XRP all try to turn a sharp correction into a tradable rebound rather than a deeper slide.
placeholder
Could XRP Really Catch Ethereum? Analysts Revisit the Question as ETF Tailwinds BuildAs US spot XRP ETFs roll out and issuers like Canary Capital and Franklin Templeton step in, analysts say XRP’s market cap could climb on growing utility and ETF accumulation—but overtaking Ethereum’s $373 billion smart-contract powerhouse remains a long-shot, at least for now.
Author  Mitrade
Nov 20, Thu
As US spot XRP ETFs roll out and issuers like Canary Capital and Franklin Templeton step in, analysts say XRP’s market cap could climb on growing utility and ETF accumulation—but overtaking Ethereum’s $373 billion smart-contract powerhouse remains a long-shot, at least for now.
placeholder
Bitcoin's Drop to $86K Approaches 'Max Pain' Zone, Yet Presents Potential Buying OpportunityAnalysts identify the $84,000 to $73,000 range as Bitcoin's likely "max pain" territory where capitulation may occur.
Author  Mitrade
Nov 21, Fri
Analysts identify the $84,000 to $73,000 range as Bitcoin's likely "max pain" territory where capitulation may occur.
placeholder
Market Meltdown: BTC, ETH, and XRP Capitulate as Bears Seize ControlBitcoin trades around $85,900 after breaking below $86,000, with Ethereum under $2,791 and XRP below $1.99 as BTC, ETH and XRP extend weekly losses of 8–10%, forcing traders to focus on supports at $85,000, $2,749 and $1.77 for clues on whether this sell-off has further to run.
Author  Mitrade
Nov 21, Fri
Bitcoin trades around $85,900 after breaking below $86,000, with Ethereum under $2,791 and XRP below $1.99 as BTC, ETH and XRP extend weekly losses of 8–10%, forcing traders to focus on supports at $85,000, $2,749 and $1.77 for clues on whether this sell-off has further to run.
goTop
quote