

XRP price could gain nearly 12% as on-chain metrics signal recovery in Ripple

Source Fxstreet
  • XRP price could rally to $0.5930, a level that has acted as support for the altcoin since November 2023.
  • Large wallet addresses holding between 10 million and 100 million XRP are scooping up the altcoin through the dip. 
  • Gradual decline in profit-taking by whales and recovery in development activity indicate there is potential for XRP price recovery. 

XRP price declined by 8% in the past week. The altcoin’s price has been in a downward trend since November 13, 2023. On-chain metrics signal a recovery in XRP price in the short term. Drivers of XRP’s price decline are likely slowing down and the altcoin has potential to recover. 

XRP price is $0.5292 at the time of writing. 

Also read: Ripple responds to SEC filing, argues the regulator is asking for irrelevant information

XRP on-chain metrics paint bullish picture for recovery

XRP’s on-chain metrics, whale transaction count, volume, market value to realized value and network realized profit/loss support a recovery in the altcoin’s price. Whale transactions valued at $100,000 and higher have declined since January 3. The count has dropped from 1,332 on January 3 to 720 on January 22. 

Alongside the declining whale transactions, there is a decrease in whale’s shedding XRP at losses. While throughout January, large wallet investors have realized losses in XRP, the volume of transactions has declined. 

XRP

Whale transaction count (>$100,000) and Network Realized Profit/Loss. Source: Santiment 

Another key on-chain metric, XRP distribution among market participants shows bullish signs. XRP holders with 10 million to 100 million tokens have consistently accumulated the asset during dips and distributed when the price hits a local peak, in the past six months. This typical behavior is likely to repeat as whales engage in XRP accumulation in the ongoing price dip. 

XRP

XRP distribution among whales. Source: Santiment 

Development activity in the altcoin hit a six month low on 17 January, 2024, before starting a recovery. As development activity recovers there is a likelihood of recovery in XRP price. 

XRP

XRP development activity. Source: Santiment 

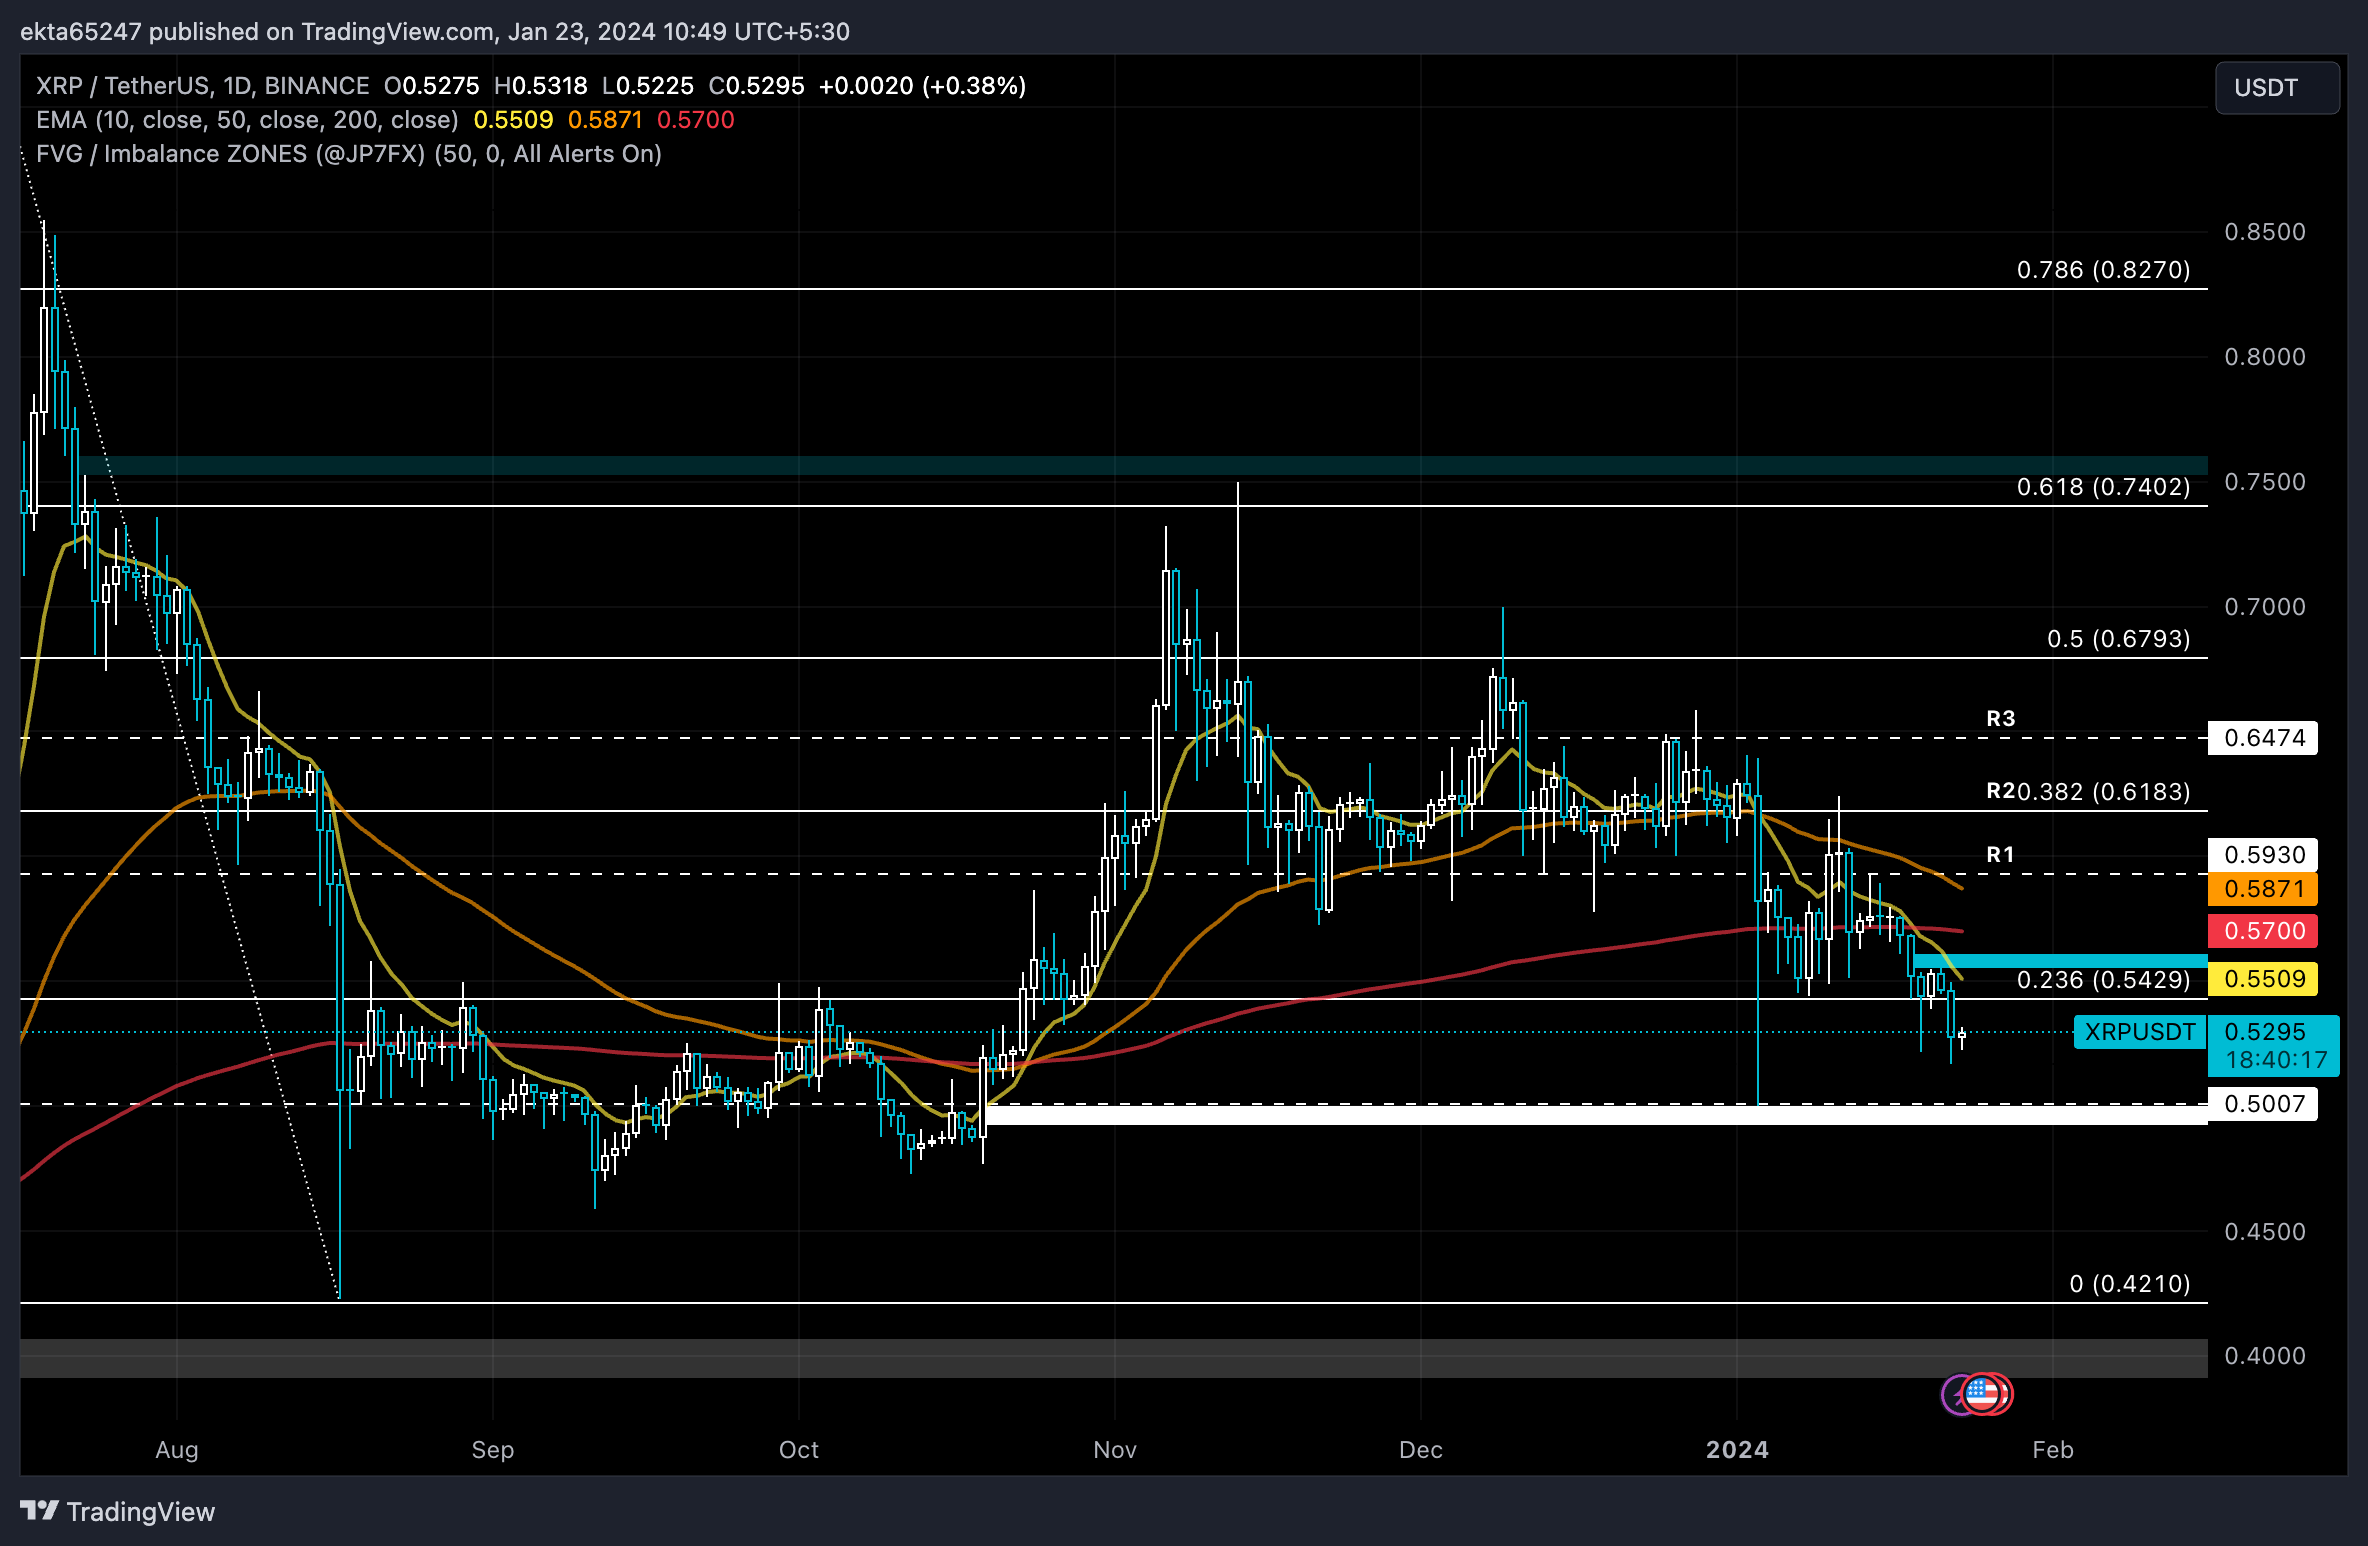
XRP price is likely to rally to $0.5930

XRP price has been in a downward trend that started in November 2023. In its recovery, XRP price is likely to tackle resistance at three levels, R1 at $0.5930, 38.2% Fibonacci Retracement of the decline between July 13 and August 17, 2023, at $0.6183 and R3 at $0.6474. 

A rally from the current price of $0.5295 to the first resistance represents a 11.97% rally in XRP price. 
XRP

XRP/USDT 1-day chart 

A daily candlestick close at $0.5007, the upper boundary of the imbalance zone could invalidate the bullish thesis for recovery in XRP price. 

Disclaimer: For information purposes only. Past performance is not indicative of future results.
placeholder
Strong profits, falling shares: bank earnings day one meets a memory-chip rout — with CPI and ASML aheadGoldman Sachs blew past estimates (EPS $17.01 vs $13.09 expected, profit +33%) while JPMorgan missed ($5.75 vs $5.93) and Wells Fargo fell 3% — yet the S&P 500 finished flat at 7,805.45, pinned below its record close as a memory-chip rout (SOX −2.67%, Micron under $1,000) kept the pressure on. Tonight brings the week's decider: US September CPI at 8:30 ET, then Bank of America, Morgan Stanley, BlackRock and ASML before the open. Here are the levels, both cases, and the watch list.
Author  Irene Q.
Oct 14, Wed
Goldman Sachs blew past estimates (EPS $17.01 vs $13.09 expected, profit +33%) while JPMorgan missed ($5.75 vs $5.93) and Wells Fargo fell 3% — yet the S&P 500 finished flat at 7,805.45, pinned below its record close as a memory-chip rout (SOX −2.67%, Micron under $1,000) kept the pressure on. Tonight brings the week's decider: US September CPI at 8:30 ET, then Bank of America, Morgan Stanley, BlackRock and ASML before the open. Here are the levels, both cases, and the watch list.
placeholder
Bitcoin's V-shaped rebound: from $80,953 back above $83,000 — spot buyers step in as the Fed softens, but ETF outflows lingerBitcoin slid to $80,953 on October 13 — then snapped back above $83,000, reclaiming the 81,847–82,305 'golden zone' on spot-led buying as Williams and Waller cooled the Fed's hawkish tone and the dollar pulled back from its 18-month high. But October ETF outflows near $386 million and a fear-and-greed reading of 56 say the repair is unfinished. Here are the levels, the transmission chain and both cases ahead of tonight's US CPI.
Author  Suzie
Oct 14, Wed
Bitcoin slid to $80,953 on October 13 — then snapped back above $83,000, reclaiming the 81,847–82,305 'golden zone' on spot-led buying as Williams and Waller cooled the Fed's hawkish tone and the dollar pulled back from its 18-month high. But October ETF outflows near $386 million and a fear-and-greed reading of 56 say the repair is unfinished. Here are the levels, the transmission chain and both cases ahead of tonight's US CPI.
placeholder
US September CPI recap: inflation hits 3.7% as core runs hot — is an October Fed hike back on the table?September CPI landed hot: headline 3.7% y/y, core 2.6% y/y and 0.3% m/m. October hike odds jumped from ~22% to ~37% — yet the dollar faded to 101.74, gold closed higher and the S&P 500 fell 1.11%. Here is the full repricing, the levels and what to watch next.
Author  Irene Q.
21 hours ago
September CPI landed hot: headline 3.7% y/y, core 2.6% y/y and 0.3% m/m. October hike odds jumped from ~22% to ~37% — yet the dollar faded to 101.74, gold closed higher and the S&P 500 fell 1.11%. Here is the full repricing, the levels and what to watch next.
placeholder
Gold defends $4,100 as BofA targets a break below $4,000 — why the Middle East bid is missingSpot gold flushed to $4,099.89, a whisker above October's $4,090 low, then rebounded to close at $4,138.25 (+0.82%) — even as US CPI ran hot. Bank of America sees gold below $4,000 within three months, citing shrinking demand and official-sector selling. Here are the levels, the drivers and what would flip the script.
Author  Irene Q.
20 hours ago
Spot gold flushed to $4,099.89, a whisker above October's $4,090 low, then rebounded to close at $4,138.25 (+0.82%) — even as US CPI ran hot. Bank of America sees gold below $4,000 within three months, citing shrinking demand and official-sector selling. Here are the levels, the drivers and what would flip the script.
placeholder
Gold Price Analysis Today | Forex Gold Analysis | XAU/USD Analysis - October 15, 2026Get the latest gold price analysis, forex gold insights, and XAU/USD analysis for October 15, 2026. Read on for the details.
Author  Mitrade
20 hours ago
Get the latest gold price analysis, forex gold insights, and XAU/USD analysis for October 15, 2026. Read on for the details.
Related Instrument
goTop
quote