

Privacy Coin Zcash (ZEC) Could Face a Price Setback After Stunning Run
Zcash (ZEC), the decentralized cryptocurrency created to improve privacy in the blockchain sector, has seen its price increase by a staggering 90% in the last 30 days.
This surge makes ZEC one of the top three performing altcoins. Trading at $41.36, this analysis explains why the coin may not be able to sustain its momentum.
The Storms Are Gathering Over Zcash Stellar Rally
On July 12, ZEC’s price was around $23.81, meaning the current price is almost double the value as of then. However, that is not the only part that has changed.
According to CoinGecko, the market cap has also substantially increased. On the same day, the cryptocurrency traded around the aforementioned price; Zcash’s market cap was $360.68 million.
For context, the market cap is a product of price and circulating supply. Even though the project’s maximum supply is 21 million — the same as Bitcoin (BTC), only 15.11 million are in circulation. At press time, the market capitalization had increased to $625.72 million, indicating that the price increase was crucial to this significant jump.
Read more: Top 7 Privacy Coins in 2024
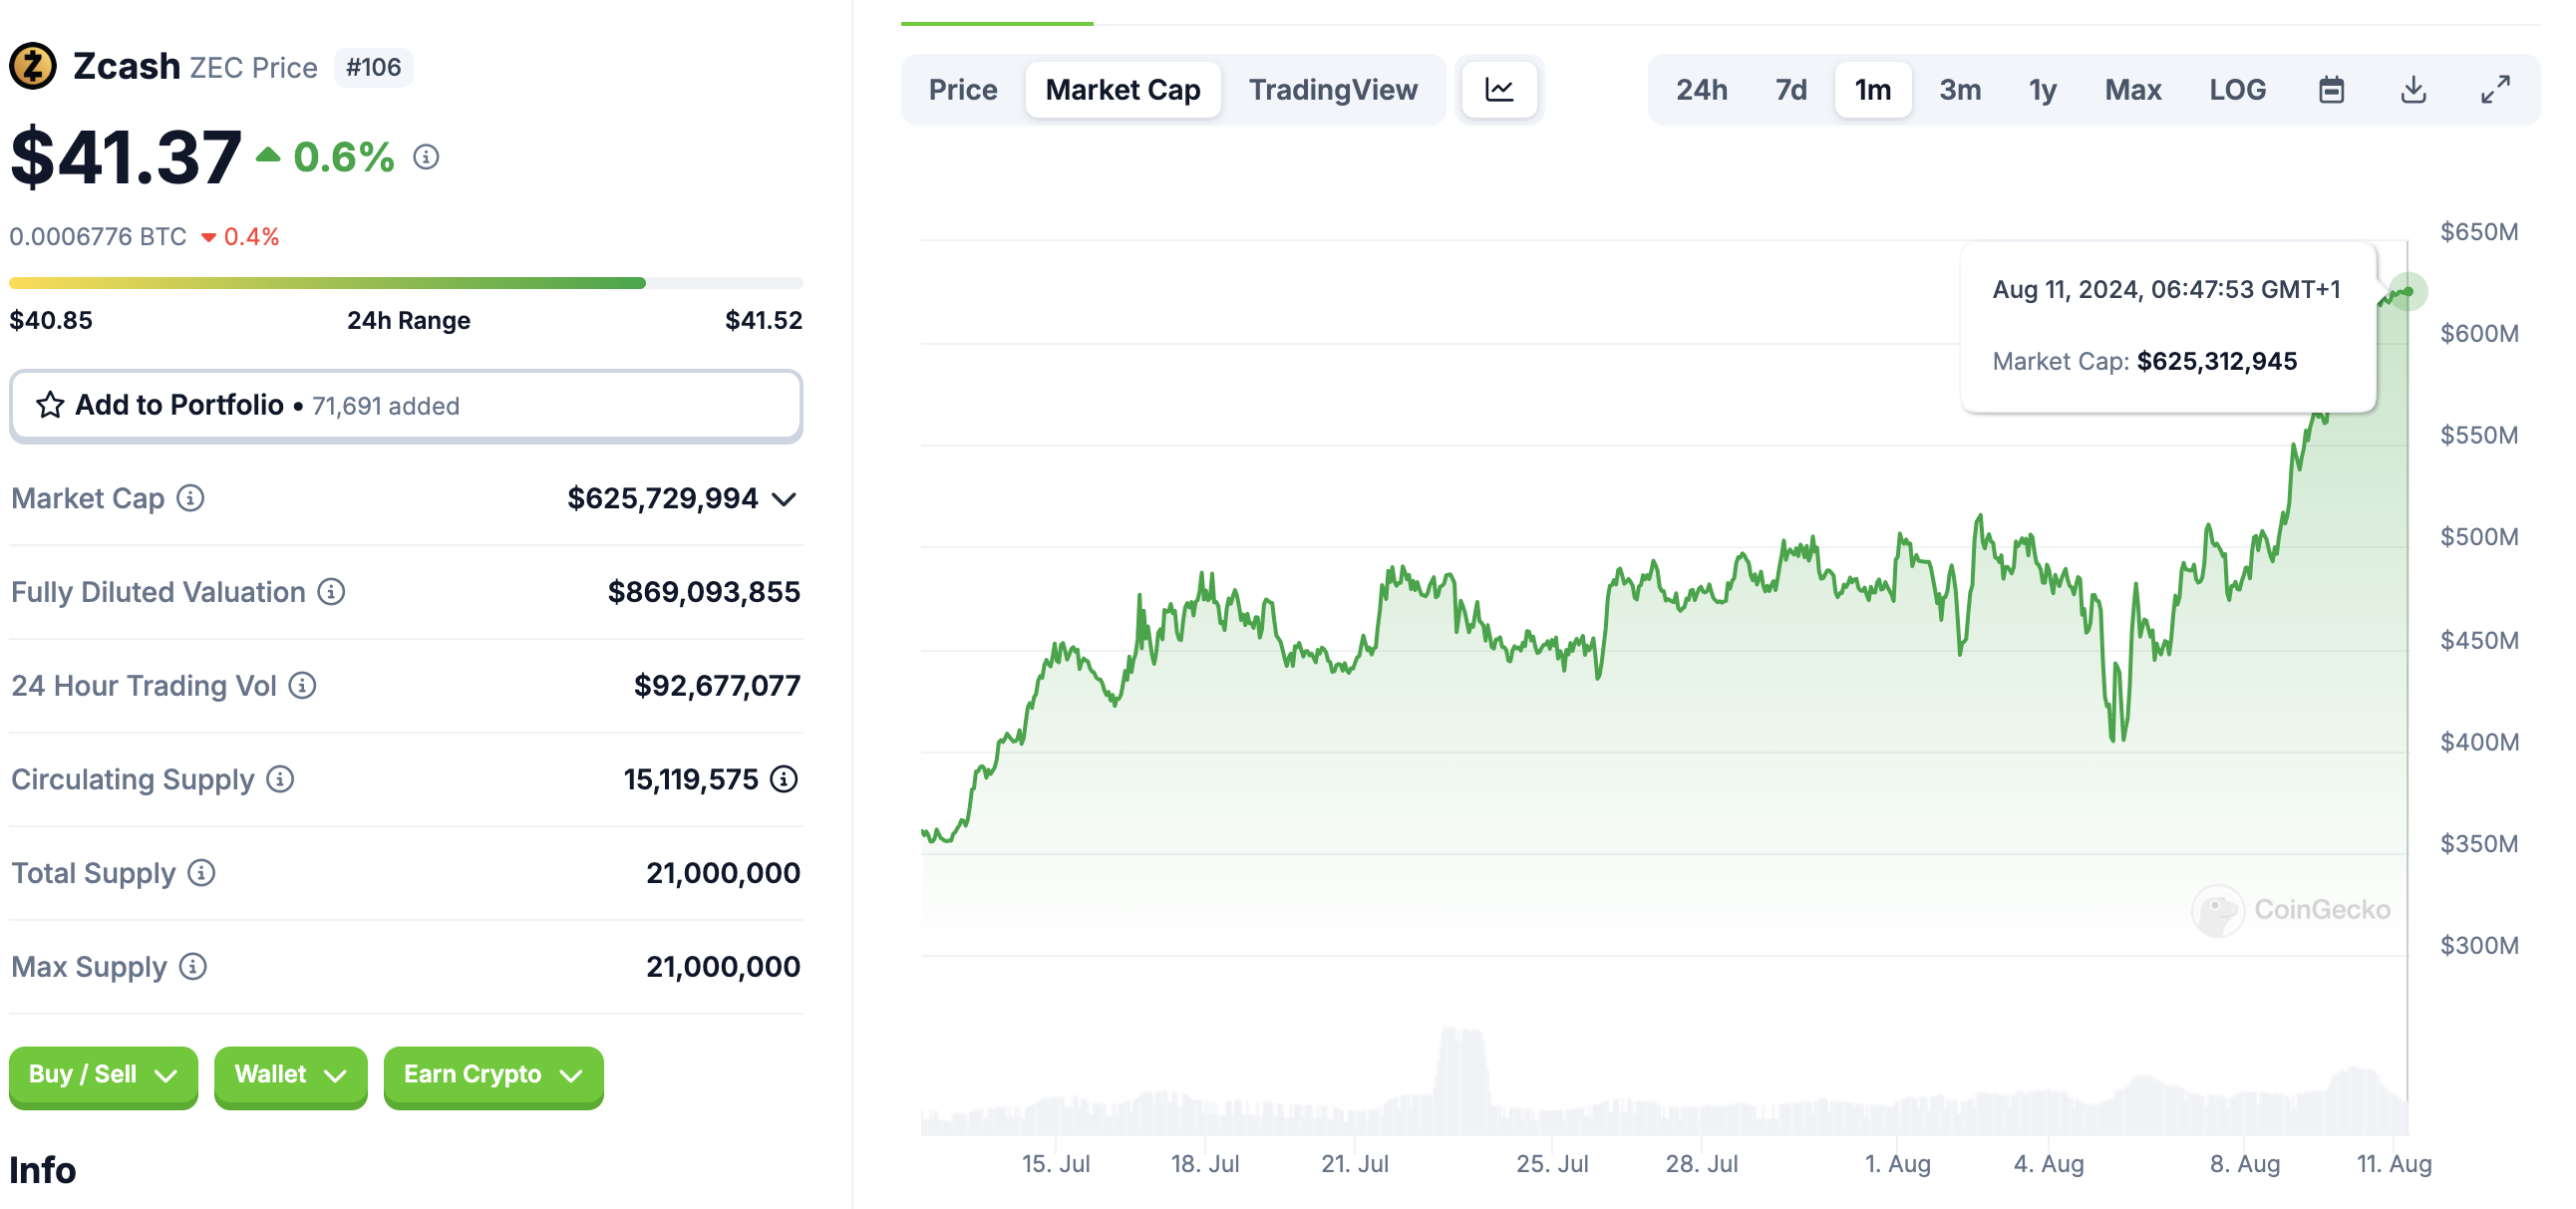 Zcash Market Capitalization. Source: CoinGecko
Despite this increase, ZEC’s volume has taken the other route. On August 10, Zcash’s volume was over $145 million, suggesting that there was a lot of interest in the cryptocurrency. But as of this writing, the metric has fallen by 44.99% to 79.66 million.
Typically, rising volume alongside rising price is a bullish sign, suggesting that there is more buying power than selling. Conversely, when volume decreases in this situation, it implies that bulls are losing dominance, and the crypto price involved risks shedding some of its value. Therefore, if the volume continues to fall, ZEC’s price could fall below $41 in the short term.
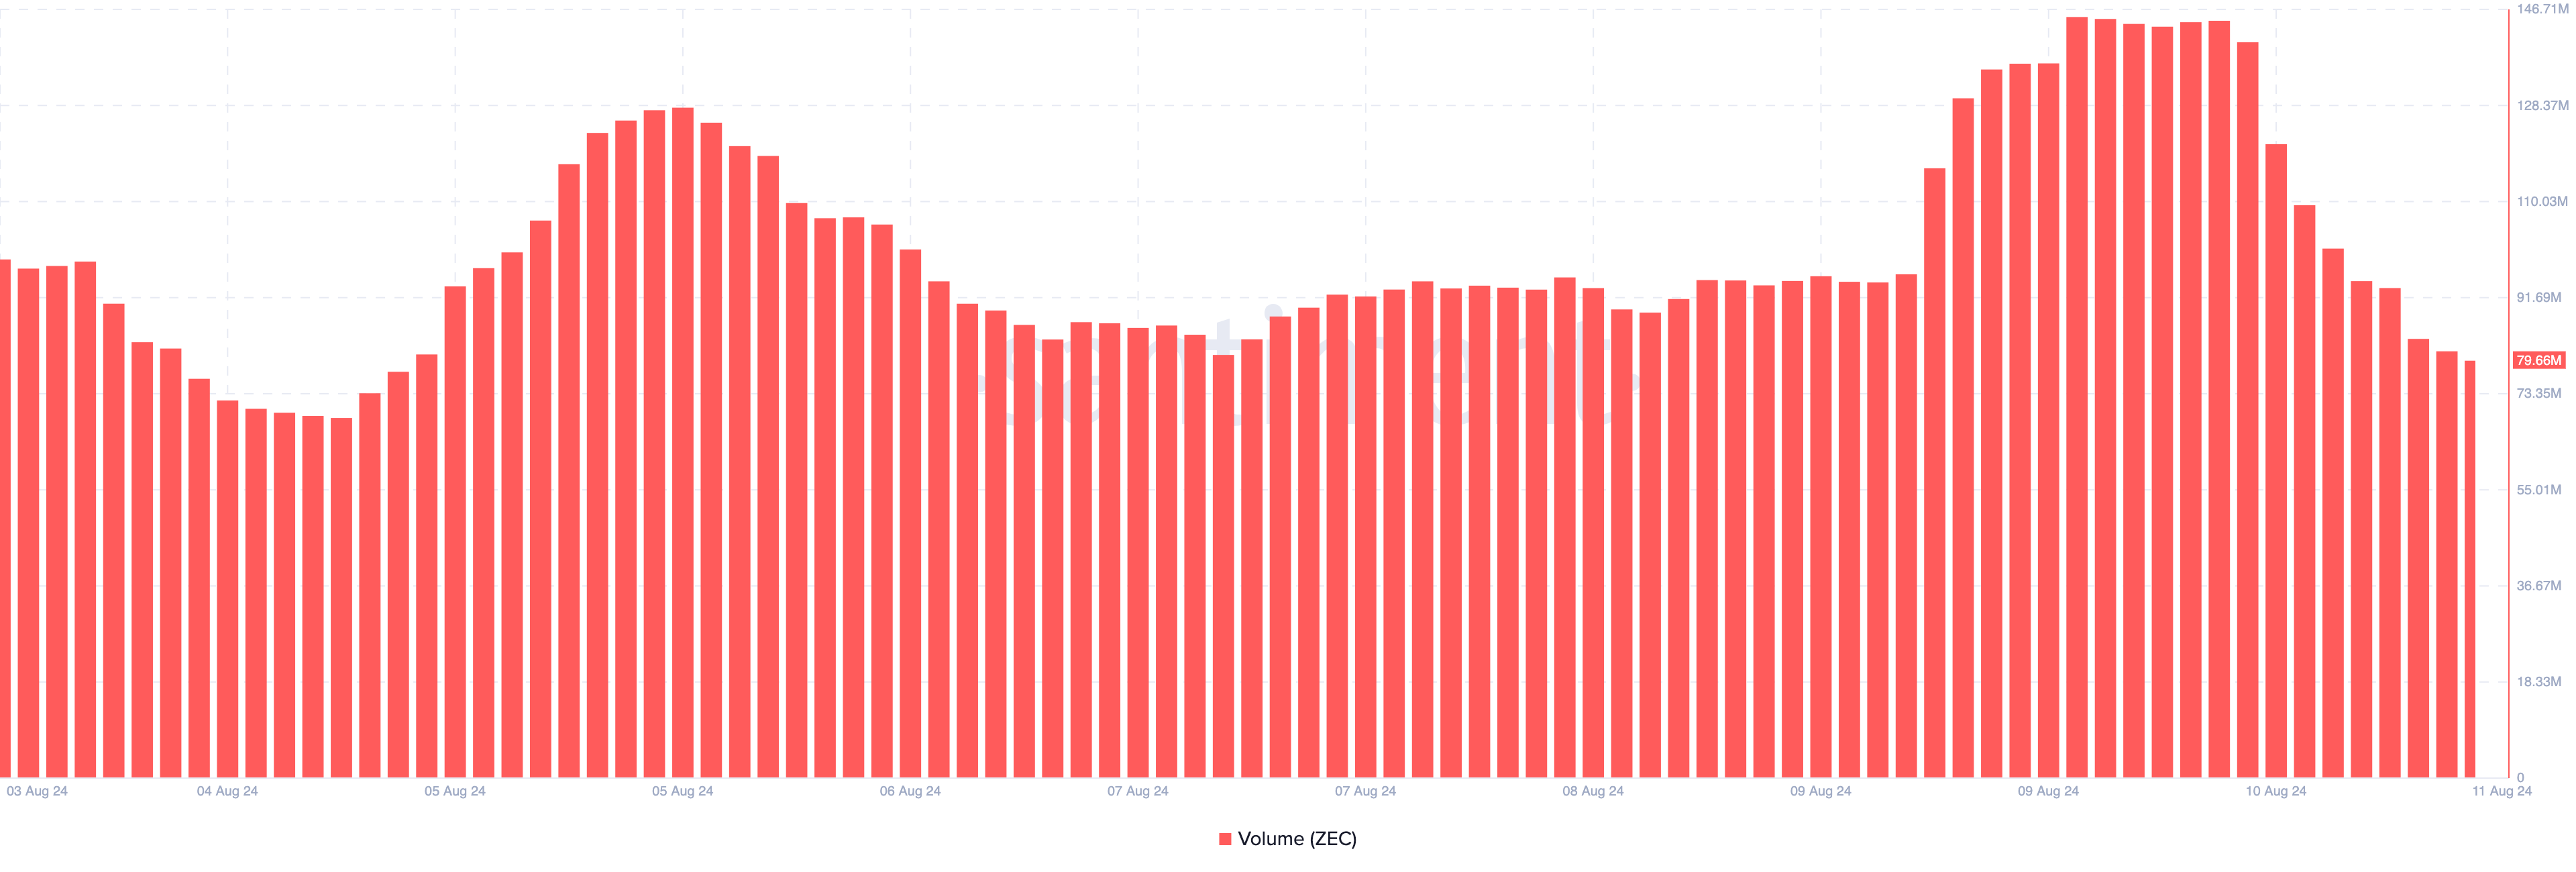 Zcash Volume. Source: Santiment
ZEC Price Prediction: Gains Days Over, Retracement Next
ZEC’s notable uptrend began in July. During that period, the coin rose from less than $18 to hit $34.75 on August 3. Moments after this, the price faced rejection, dropping to a swing low of $25.43.
However, supported by increasing bullish momentum, the coin reached a peak of $42.97. Meanwhile, the Relative Strength Index (RSI) is 77.02 at press time. The RSI is a technical indicator that measures the magnitude of speed and price changes to determine momentum.
It also tells when a cryptocurrency is overbought or oversold. Readings at 70.00 or above mean a coin is overbought, while those at 30.00 are oversold. When oversold, the price of a crypto can reverse to the upside.
Therefore, in ZEC’s case, a retracement could be next. Using the Fibonacci retracement levels — an indicator helpful in identifying support and resistance, ZEC’s price could drop to $37.18 in the short term.
Read more: Zcash (ZEC) Price Prediction 2024/2025/2030
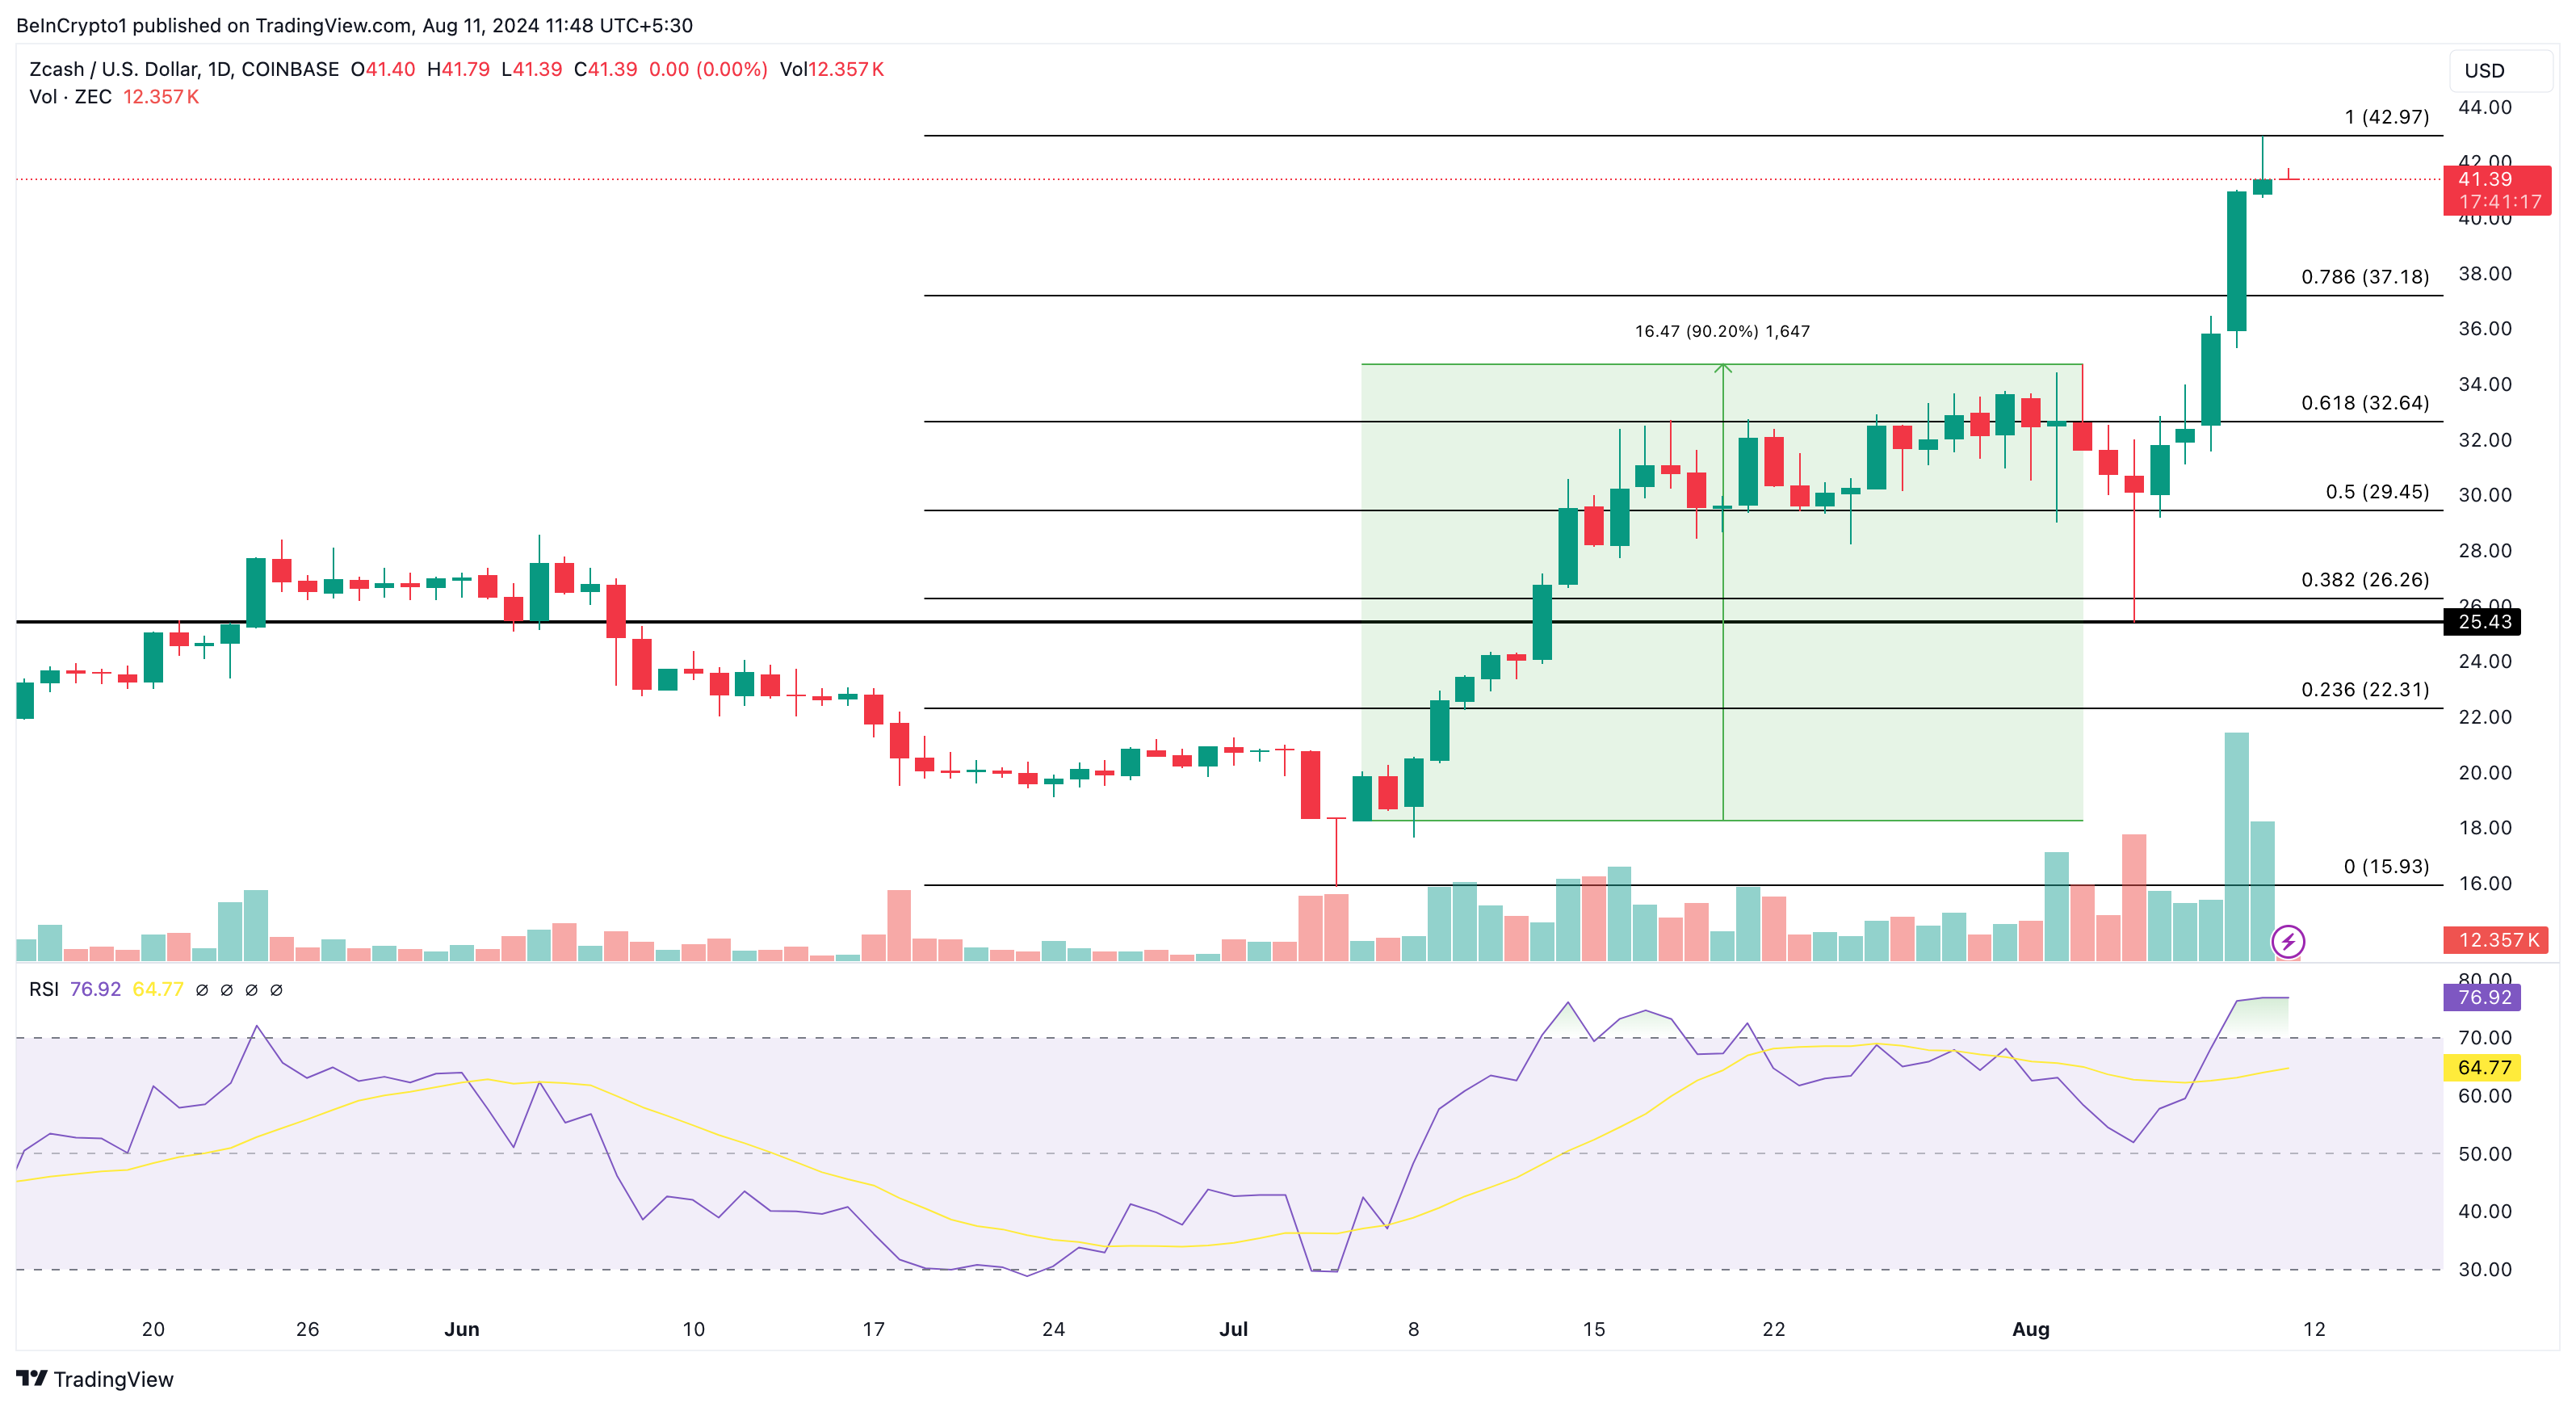 Zcash Daily Analysis. Source: TradingView
However, a bounce from this level may halt another downturn. Instead, particularly if buying pressure increases, ZEC may exceed $42.97 and probably test the $44 region.
Recommended Articles


