

Bitcoin Weekly Forecast: Can BTC bounce back from recent market crash?
- Arkam Intelligence data shows major investors retained their Bitcoin holdings during Monday's sell-off.
- Bitcoin UTXO loss (%) ratio is similar to the 2020 bull cycle.
- On-chain data suggests that permanent holder addresses are accumulating BTC despite the recent turmoil.
- Cryptoquant data shows that futures trading volume hit an all-time high, spot trading volume hit the second-highest ever this week.
Bitcoin (BTC) trades above $60,000 on Friday after a 7.2% decline and a dip below the $50,000 level earlier in the week, following a test of its daily support level at around $49,900 on Monday. Arkham Intelligence data reveals that major investors such as BlackRock, MicroStrategy, Grayscale, and Fidelity retained their Bitcoin holdings during the sell-off. Additionally, on-chain data indicates that permanent holder addresses continue accumulating BTC despite recent market fluctuations.
Correlation with previous bull run
CryptoQuant data shows that the percentage of Bitcoin UTXOs in loss in 2024 is notably high, similar to the significant correction seen during the 2020 bull cycle. Although the US Federal Reserve’s (Fed) swift and extensive quantitative easing during COVID-19 helped cushion the 2020 crash, such immediate policy responses are less feasible now. However, due to the prolonged market adjustment, there is a strong possibility of future liquidity support through interest rate cuts by the Fed starting in September. Despite the recent severe downturn this week, it might still be too early to conclusively label the market as being in a bear phase.
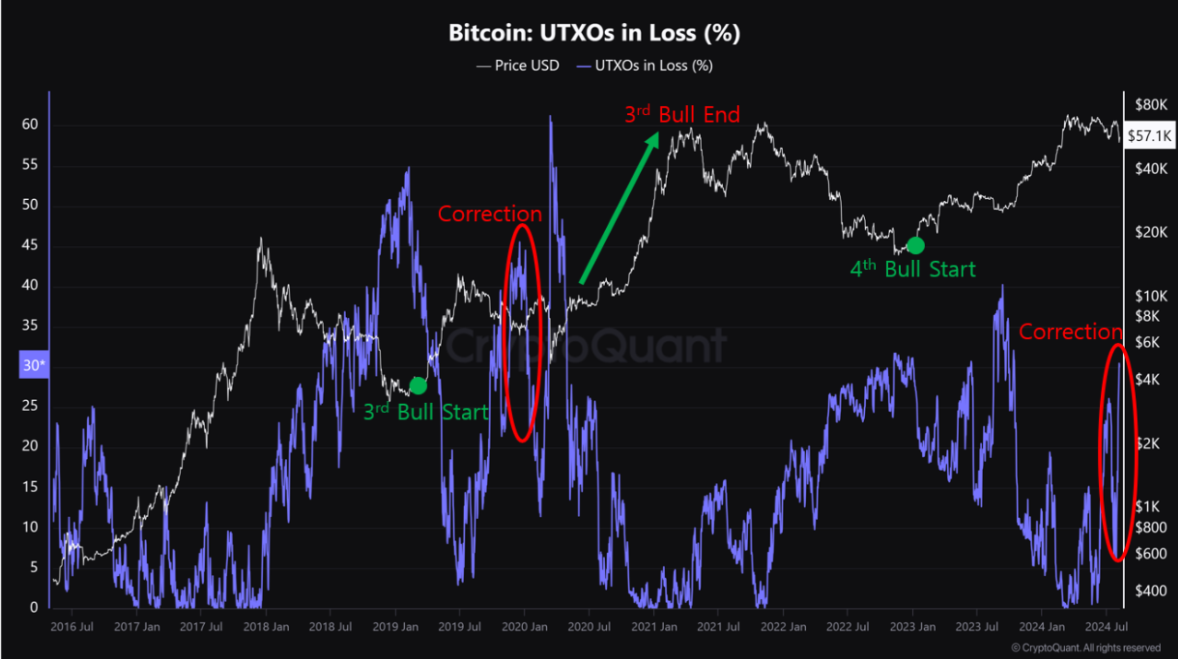
Bitcoin UTXO’s in Loss(%) chart
Institutional investors hold firm despite recent market sell-off
Arkham Intelligence data reveals that during Monday's market sell-off, major institutional investors like BlackRock, MicroStrategy, Grayscale, and Fidelity chose to hold onto their Bitcoin holdings, signaling strong confidence in the cryptocurrency's future.
You guys sold all your coins
— Arkham (@ArkhamIntel) August 5, 2024
… But
BlackRock
MicroStrategy
Grayscale
Fidelity
didn’t. pic.twitter.com/R2NY3rDPcQ
Additionally, CryptoQuant data reveals that 404,448 Bitcoins have been transferred to permanent holder addresses in the past 30 days. This indicates accumulation and suggests investor confidence in BTC has led them to purchase recent dips. With this metric reaching new records, it points to a calculated strategy by holders, who see the current price dip as a brief pause in Bitcoin's long-term rise.
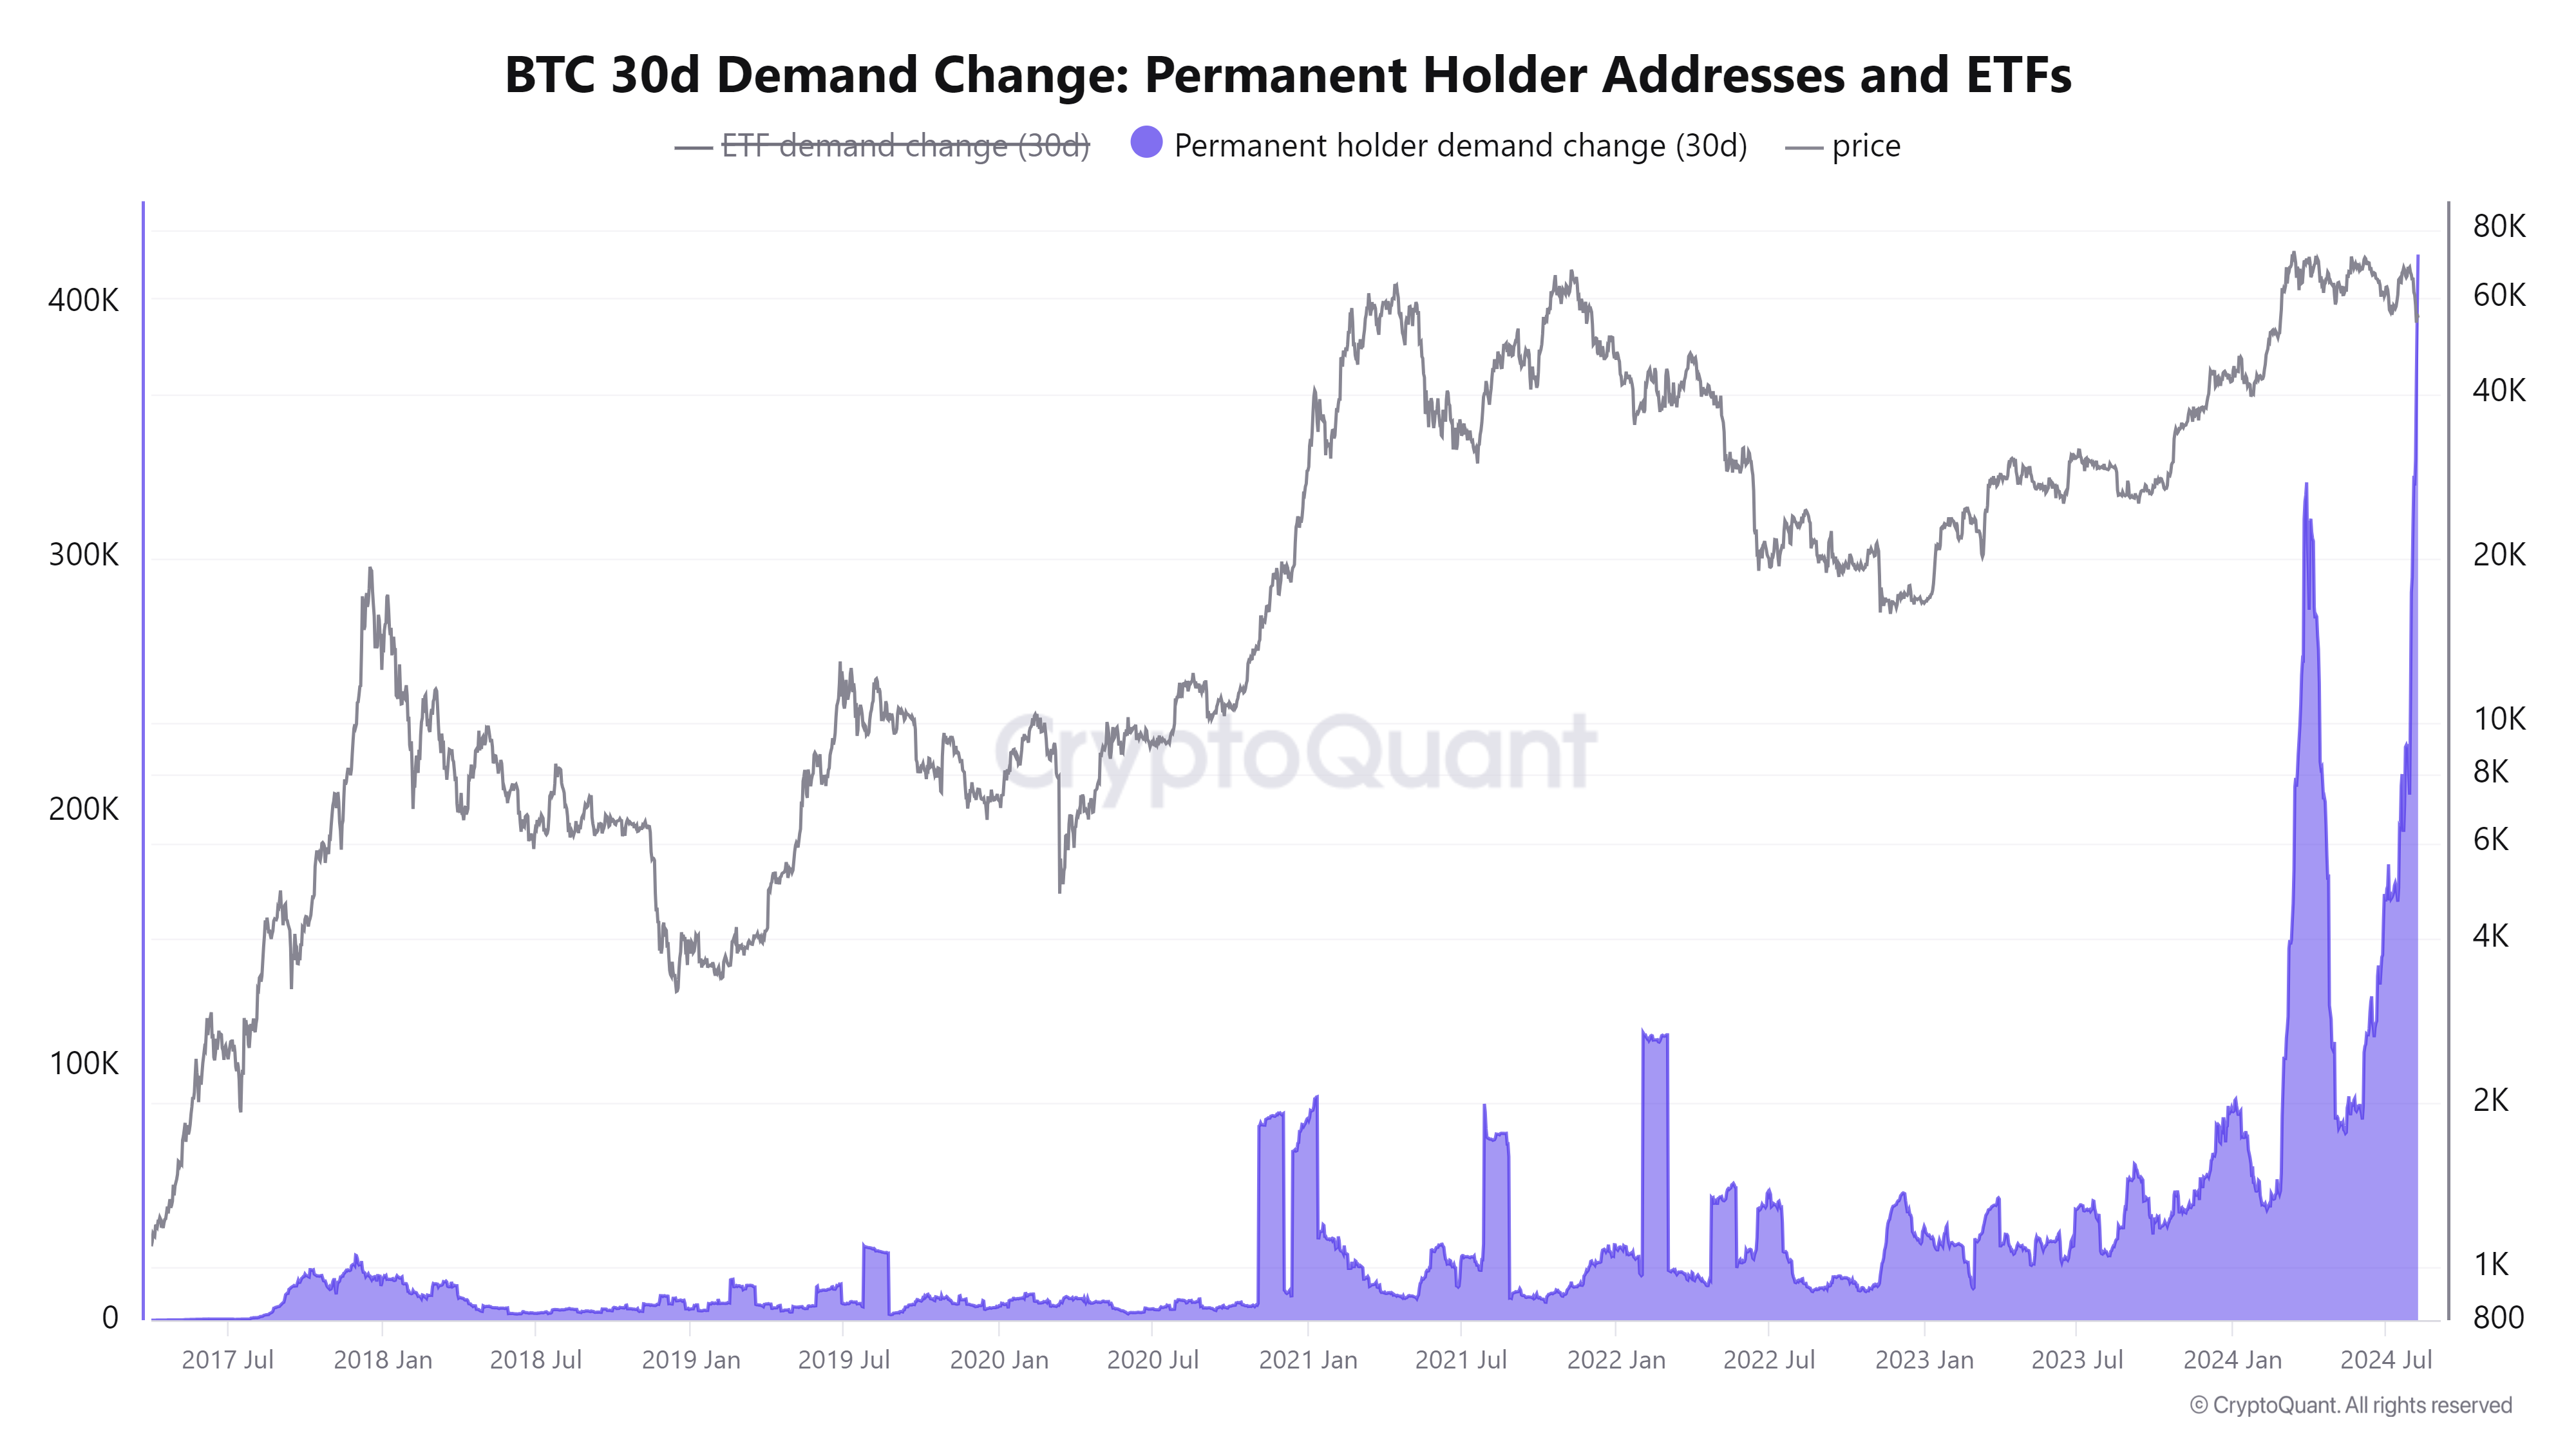
BTC 30d demand change chart
Highest volume record in futures and spot trading
According to CryptoQuant and its founder and CEO, Ki Young Ju, who shared insights on X when Bitcoin's drop below the $50,000 level led to an all-time high in futures trading volume at $154 billion, while spot trading volume reached $83 billion, the second-highest ever recorded this week. This event indicates heightened trading activity and investor interest in Bitcoin amidst recent market fluctuations.
On the day #Bitcoin dropped to $50K, futures trading volume hit an ATH of $154B, and spot trading volume reached $83B, the second-highest ever. pic.twitter.com/TJLUaSXuW3
— Ki Young Ju (@ki_young_ju) August 8, 2024
Is BTC out of the woods?
Bitcoin price retested the 61.8% Fibonacci retracement level at $62,066 on Thursday (drawn from the swing high of $70,079 on July 29 to Monday's low of $49,101). As of Friday, it trades slightly lower by 1.06% at $61,058.
If BTC faces rejection at the $62,066 level, which coincides with the broken trendline and the 100-day Exponential Moving Average (EMA) at around $63,021, selling pressure could increase.
Failure to break above $62,066 might trigger a 19% crash, back to retest the $49,917 daily support level.
The Relative Strength Index (RSI) indicator in the daily chart faces resistance around the neutral level of 50, and the Awesome Oscillator (AO) is still below its neutral level of zero. These momentum indicators strongly indicate bearish dominance.
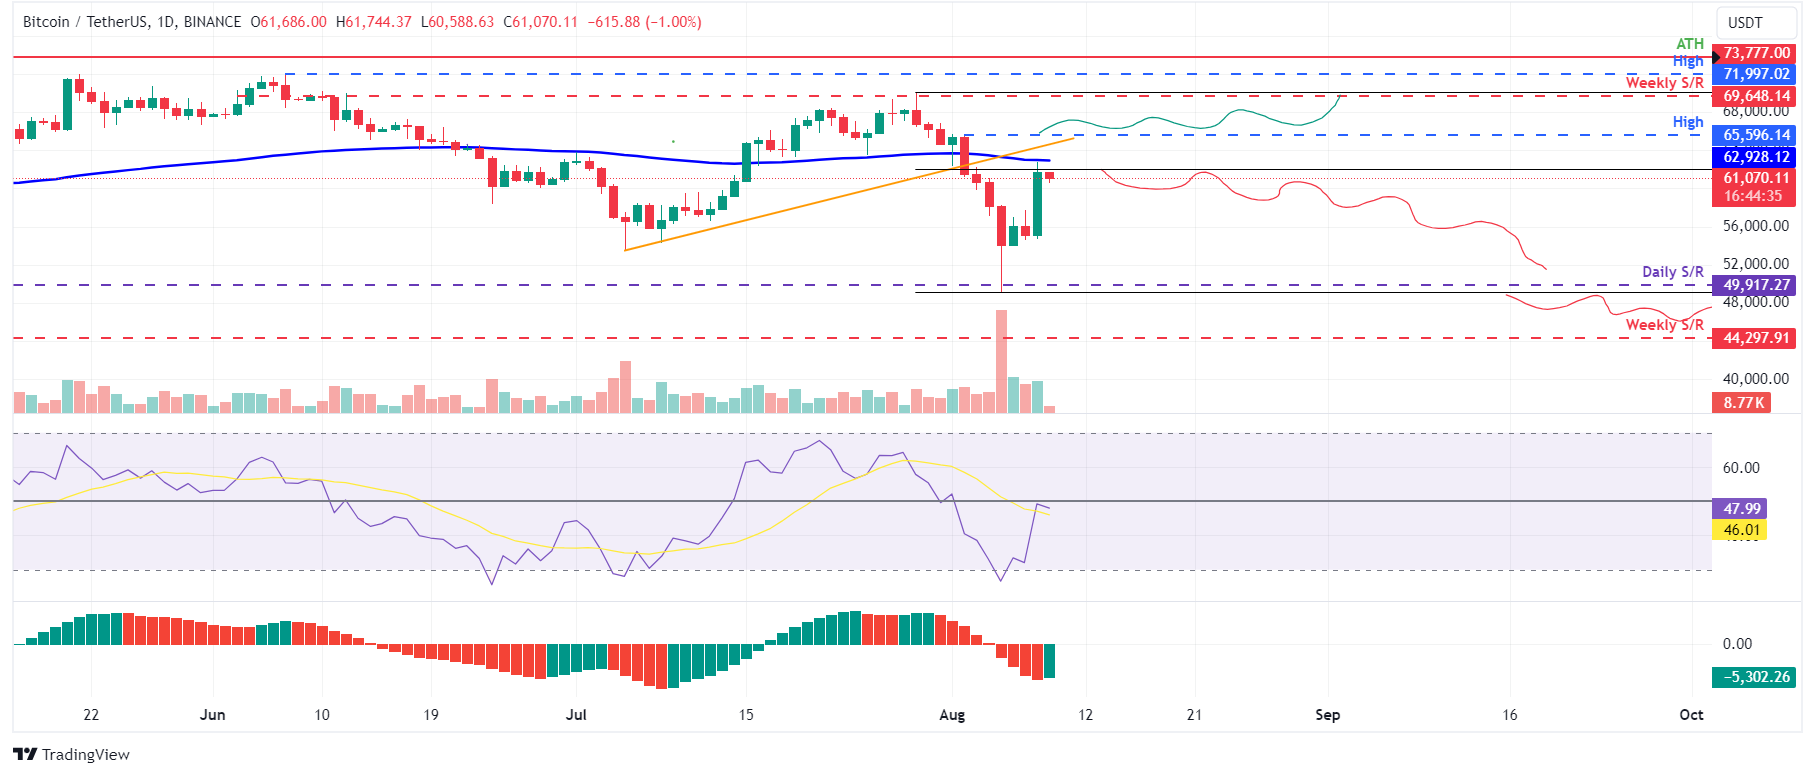
BTC/USDT daily chart
On the other hand, If BTC closes above the August 2 high of $65,596, it would change the market structure by forming a higher high on the daily timeframe. Such a scenario might drive a 6% rise in Bitcoin's price to retest its weekly resistance at $69,648.
Recommended Articles


