

Bitcoin Sellers Running Out Of Coins As Dominance Hits 3-Year High

Source Newsbtc

Crypto analyst Rekt Capital has provided some form of optimism for Bitcoin investors, suggesting that the massive sell pressure on the flagship crypto is almost over. This comes amid a significant surge in Bitcoin’s dominance.

Bitcoin Seller Exhaustion Is At Its Peak

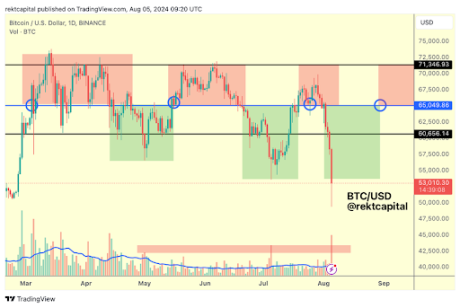
In an X (formerly Twitter) post, Rekt Capital mentioned that “the sell-side volume has reached and even dramatically eclipsed Seller Exhaustion levels seen at previous price reversals to the upside.” The analyst added that Bitcoin hasn’t seen this level of sell-side volume since the Halving event in April earlier this year. 
Bitcoin 1

This undoubtedly presents a bullish development for the flagship crypto since Bitcoin is bound to witness a massive reversal with the sell pressure almost over. This is already happening, as Bitcoin has rebounded in the last 24 hours, following its drop below $50,000 for the first time since January. 

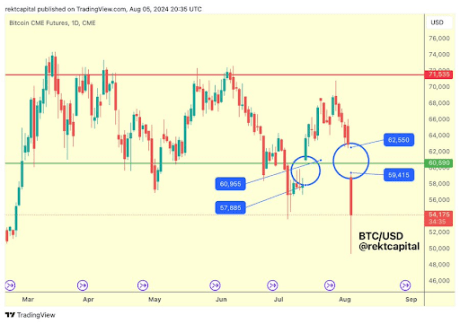
Rekt Capital also suggested that Bitcoin could rebound to as high as $62,550 in the short term as it looks to fill the CME gap, which is currently between $59,400 and $62,550. He noted that the odds favor Bitcoin filling this gap since the crypto token has filled all of the CME Gaps it has created over the past several months. 
BTC 2

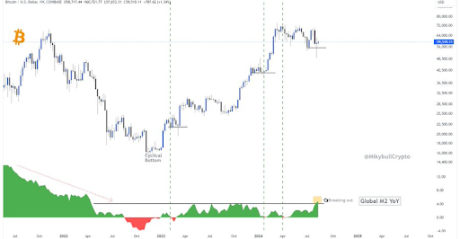
Crypto analyst Skew also commented on the massive sell-side volume that Bitcoin recently experienced. He explained that this happened because Bitcoin failed to hold above $70,000 following its July price rebound. The analyst added that there is “no actual chaos yet,” suggesting there was no need to be worried about the recent price correction. 
Bitcoin 3

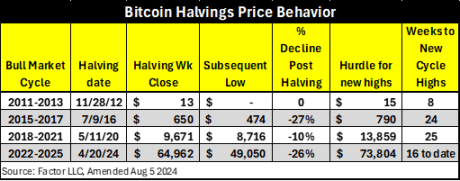
With seller exhaustion at its peak, there is also the likelihood that Bitcoin has found a bottom and that this could be the final correction before the bull run kicks into full gear. Veteran trader and analyst Peter Brandt noted that Bitcoin’s decline since the halving means it has now achieved a price drop similar to the one during the 2015 to 2017 Halving bull market cycle. 
BTC 4

BTC’s Dominance Hits 3-Year High

Amid the market turmoil, data from Coinglass shows that Bitcoin’s dominance recently hit its highest level since April 2021. This rise has been largely due to the Spot Bitcoin ETFs, which have caused new money to flow into the Bitcoin ecosystem. Meanwhile, altcoins have had to battle for capital from existing retail investors who continue to divest their money between several crypto assets. 

Crypto analysts like Roman have suggested that Bitcoin’s dominance will likely continue to rise for now, as he predicted that the flagship crypto will continue to suck up all the liquidity until later this year. He expects Ethereum and other altcoins to continue trading sideways during this period.  

At the time of writing, Bitcoin is trading at around $56,000, up over 10% in the last 24 hours, according to data from CoinMarketCap.

Bitcoin price chart from Tradingview.com

Featured image from Cointribune, chart from Tradingview.com

Disclaimer: For information purposes only. Past performance is not indicative of future results.
placeholder
Nvidia slid 7.7% after hours while AMD and Broadcom rose — the AI trade changed hands, it didn't breakNvidia closed Wednesday at 173.73, up 2.87%, then fell as much as 8.1% to 159.44 after reports that its board was preparing for a possible leadership change. The same session, the Philadelphia Semiconductor Index rose 5.7% with all 30 components higher, CoreWeave jumped 24.7% on 168% revenue growth, and Micron added 11.9%. If AI demand were being repriced, AMD and Broadcom would not be bid. This is a governance discount on one name, and 204.54 — the 200-day average — is the level that settles it.
Author  Irene Q.
Nov 12, Thu
Nvidia closed Wednesday at 173.73, up 2.87%, then fell as much as 8.1% to 159.44 after reports that its board was preparing for a possible leadership change. The same session, the Philadelphia Semiconductor Index rose 5.7% with all 30 components higher, CoreWeave jumped 24.7% on 168% revenue growth, and Micron added 11.9%. If AI demand were being repriced, AMD and Broadcom would not be bid. This is a governance discount on one name, and 204.54 — the 200-day average — is the level that settles it.
placeholder
Gold hit a one-year low while central banks bought 321 tonnes — the sellers were never the ones you thinkSpot gold closed at 3,876 on Thursday, down 2.8% and its lowest close in more than a year, with an intraday low near 3,852. The dollar is at a 19-month high of 103.21 and the 10-year yield is at 5.10%, so the price move is easy to explain. What is harder to explain is who sold: central banks bought 321 tonnes in Q3, the PBoC added for a 24th straight month, ETF holdings are near a record 4,256 tonnes, and roughly 95% of the futures selling came from non-reportable and sovereign-type accounts rather than hedge funds. This piece separates the two books that have to balance.
Author  Irene Q.
Nov 13, Fri
Spot gold closed at 3,876 on Thursday, down 2.8% and its lowest close in more than a year, with an intraday low near 3,852. The dollar is at a 19-month high of 103.21 and the 10-year yield is at 5.10%, so the price move is easy to explain. What is harder to explain is who sold: central banks bought 321 tonnes in Q3, the PBoC added for a 24th straight month, ETF holdings are near a record 4,256 tonnes, and roughly 95% of the futures selling came from non-reportable and sovereign-type accounts rather than hedge funds. This piece separates the two books that have to balance.
placeholder
Brent rose 3.3% and US crude stocks built 4.66 million barrels in the same weekBrent January settled at 95.82, up 3.3%, and WTI at 88.74, up 2.55%, after the US signalled it would not pursue a deal with Iran and attacks on Gulf shipping continued. In the same week, EIA data showed US crude inventories rising 4.657 million barrels against expectations of a 1.1 million draw, with gasoline up another 1.799 million. OPEC output also rebounded 1.96 million barrels a day to 27.16 million in October, led by Saudi Arabia at 10.56 million. This piece separates the geopolitical premium from the physical balance and lays out where each side of the trade is anchored.
Author  Irene Q.
Nov 13, Fri
Brent January settled at 95.82, up 3.3%, and WTI at 88.74, up 2.55%, after the US signalled it would not pursue a deal with Iran and attacks on Gulf shipping continued. In the same week, EIA data showed US crude inventories rising 4.657 million barrels against expectations of a 1.1 million draw, with gasoline up another 1.799 million. OPEC output also rebounded 1.96 million barrels a day to 27.16 million in October, led by Saudi Arabia at 10.56 million. This piece separates the geopolitical premium from the physical balance and lays out where each side of the trade is anchored.
placeholder
Anthropic is six times oversubscribed at $1.4 trillion while Nvidia is down 32% — the AI trade has two pricesAnthropic lists on Nasdaq as ANT on Thursday at $70 ~ $78 a share, raising up to $64.4 billion at a target valuation near $1.4 trillion, and the book is reportedly six times covered. In the same six weeks, Nvidia has fallen 32% and the QQQ is 10.9% below its October peak. Private capital and public markets are marking the same AI complex at two very different prices. This piece separates the two books: what the S-1 shows, who is anchoring the $26 billion private placement, and what Thursday's debut would have to do to change the public tape.
Author  Irene Q.
6 hours ago
Anthropic lists on Nasdaq as ANT on Thursday at $70 ~ $78 a share, raising up to $64.4 billion at a target valuation near $1.4 trillion, and the book is reportedly six times covered. In the same six weeks, Nvidia has fallen 32% and the QQQ is 10.9% below its October peak. Private capital and public markets are marking the same AI complex at two very different prices. This piece separates the two books: what the S-1 shows, who is anchoring the $26 billion private placement, and what Thursday's debut would have to do to change the public tape.
placeholder
Gold Price Analysis Today | Forex Gold Analysis | XAU/USD Analysis - November 16, 2026Get the latest gold price analysis, forex gold insights, and XAU/USD analysis for November 16, 2026. Read on for the details.
Author  Mitrade
6 hours ago
Get the latest gold price analysis, forex gold insights, and XAU/USD analysis for November 16, 2026. Read on for the details.
goTop
quote