

Ethereum bulls ride the dip with heavy buying pressure after Black Monday sell-off
- Ethereum ETF investors show strength, forcing net inflows despite the bearish turbulence.
- Ethereum exchange netflows witnessed an exodus of 152.4K ETH, suggesting investors bought the dip heavily after massive sell-off.
- Ethereum may have bottomed and could be set for a rally despite bearish trend.
Ethereum (ETH) is up 2% on Tuesday as traditional and crypto-native investors have been scooping up ETH after the dip from Black Monday's sell-off. ETH also appeared to have found a bottom and could be set to reclaim the $2,803 support level.
Daily digest market movers: Ethereum bulls buy the dip
Ethereum's crash on Monday saw several whales return to the market, buying up the dump from investors who capitulated following the high FUD across the market. The buying pressure was visible across crypto-native and traditional investors, as many may have viewed the dip as an opportunity to purchase ETH at discounted prices.
On the traditional market landscape, spot Ethereum ETFs recorded $48.73 million in net inflows on Monday despite outflows across Bitcoin ETFs, per Farside Investors data. This is only the third time ETH ETFs have seen net inflows after launch day.
Grayscale Ethereum Trust (ETHE) asset loss continued to diminish as it experienced $46.8 million in outflows — its lowest since ETH ETFs launch. BlackRock's ETHA and Fidelity's FETH had inflows of $47.1 million and $16.2 million, respectively, while Van Ecks' ETHV had its largest buying day since launch with $16.6 million in inflows.
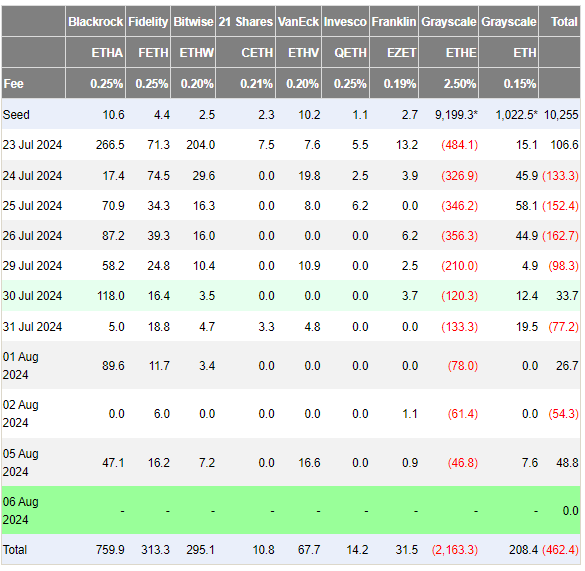
ETH ETF Flows
Crypto-native investors also pounced on the dip, as ETH recorded a total exchange net outflow of 152.4K ETH — its highest since June 12 — as prices dipped to around $2,400, according to CryptoQuant's data. In addition, ETH exchange reserves, which have been rising since the beginning of July, flipped on Monday and have now begun to fall. This indicates increased buying pressure among investors.
 - All Exchanges (SMA 30)-638585659536891125.png)
ETH Exchange Netflows
Lookonchain data noted that five whale addresses purchased 144,071 ETH worth over $331.11 million during the crash.
However, some crypto community members think this may be bearish for ETH in the long term, expressing sentiments that most buying activity may be from investors looking to make a quick profit if ETH quickly rebounds.
Bullish or Bearish on $ETH?
— Lookonchain (@lookonchain) August 6, 2024
We noticed that 5 whale addresses bought 144,071 $ETH($331.11M) during the market crash!
7 Siblings spent 129.3M $USDC to buy 56,093 $ETH at $2,305.
0x267e...f91e spent 101.97M $USDC to buy 44,653 $ETH at $2,284.
#Nomad Bridge Exploiter spent… pic.twitter.com/yZoHPUn5eC
Ethereum also recorded its highest trading volume across the spot and futures market since May 2021, as per Coinalyze. The high activity across the Ethereum network saw gas fees rise to levels last seen before March's Dencun upgrade. The spike in fees saw 5,222.45 ETH burnt — also the highest since March 14, according to data from Etherscan.
ETH technical analysis: Ethereum's decline could help reset it for a rally
Ethereum is trading around $2,500 on Tuesday, up 2% on the day. Prices seem to have stabilized after heavy liquidations from the market crash on Monday. The total ETH liquidations in the past 24 hours have slowed to $76.82 million. Long liquidations have reduced to $30.54 million, trailing short liquidations, which have crossed $46 million.
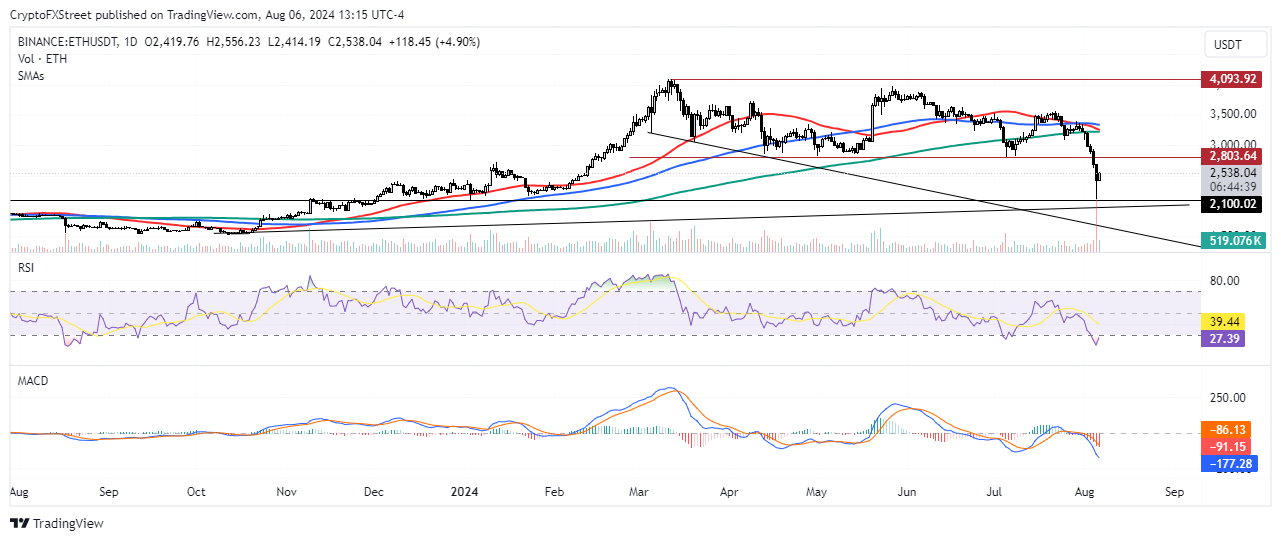
ETH/USDT Daily chart
ETH found support around the $2,100 price range after the massive sell-off on Monday.
The Moving Average Convergence Divergence (MACD) indicator shows that bearish momentum is dominant after the MACD line (blue line) fell to -177 and crossed below the signal line (orange line). This is further strengthened by the 50-day simple moving average (SMA) breaching the 100-day SMA and attempting to go below the 200-day SMA.
While the outlook is bearish, the RSI indicator suggests that ETH may have found a bottom and could see a rebound.
The Relative Strength Index (RSI) shows that ETH is oversold. It fell to 21, a one-year low last seen in August 2023. The last time the RSI hit this level, ETH consolidated for a few weeks and began a rally that lasted for seven months before the market correction in late March.
The RSI, coupled with the on-chain and ETF buying pressure, suggests ETH could quickly reclaim the $2,803 support level and stage a rally to tackle the rectangle's upper side resistance at $4,093 — its yearly high. The thesis will be invalidated if ETH breaches the $2,100 support level.
Ethereum FAQs
Ethereum is a decentralized open-source blockchain with smart contracts functionality. Serving as the basal network for the Ether (ETH) cryptocurrency, it is the second largest crypto and largest altcoin by market capitalization. The Ethereum network is tailored for scalability, programmability, security, and decentralization, attributes that make it popular among developers.
Ethereum uses decentralized blockchain technology, where developers can build and deploy applications that are independent of the central authority. To make this easier, the network has a programming language in place, which helps users create self-executing smart contracts. A smart contract is basically a code that can be verified and allows inter-user transactions.
Staking is a process where investors grow their portfolios by locking their assets for a specified duration instead of selling them. It is used by most blockchains, especially the ones that employ Proof-of-Stake (PoS) mechanism, with users earning rewards as an incentive for committing their tokens. For most long-term cryptocurrency holders, staking is a strategy to make passive income from your assets, putting them to work in exchange for reward generation.
Ethereum transitioned from a Proof-of-Work (PoW) to a Proof-of-Stake (PoS) mechanism in an event christened “The Merge.” The transformation came as the network wanted to achieve more security, cut down on energy consumption by 99.95%, and execute new scaling solutions with a possible threshold of 100,000 transactions per second. With PoS, there are less entry barriers for miners considering the reduced energy demands.
Recommended Articles


