

Bitcoin price could fall below $40,000 as altcoins might outperform in 2024, hedge fund analysts say

Source Fxstreet
  • Bitcoin price has crashed by over 12% in the past week to fall from $46,700 to $40,901 at the time of writing.
  • Pantera Capital’s report suggests that the market is set to move into Phase 2, wherein altcoins will outperform BTC.
  • Bitcoin’s dominance has hit a three-month low and is close to falling below commanding 50% of the crypto market.

Bitcoin price was expected to witness an extensive bull run following the approval of spot BTC ETFs, but, surprisingly, this did not happen. In fact, the biggest cryptocurrency in the world is trending downwards at the moment, lurking around monthly lows. This might give the altcoins a very crucial opening to take over BTC.

Bitcoin to lose in Phase 2

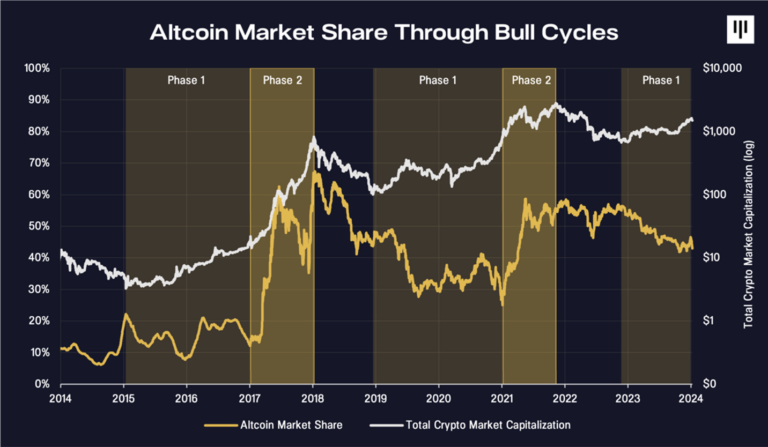
Pantera Capital, one of the largest and oldest crypto-focused hedge funds, released its report for what to expect in 2024, and it does not seem too good for Bitcoin. Bitcoin and altcoin rallies tend to move in cycles, with the first phase generally being the former riding the bullishness and the second phase witnessing altcoins taking over the market.

Bitcoin outperforms altcoins in Phase 1 and vice versa in Phase 2. This phenomenon was witnessed in the past during the 2015-2018 bull run and then again during the 2019 - 2022 bull run cycle. In both cases, the last year ended up being Phase 2, where alts outperformed BTC.
Bitcoin bull cycles

Bitcoin bull cycles

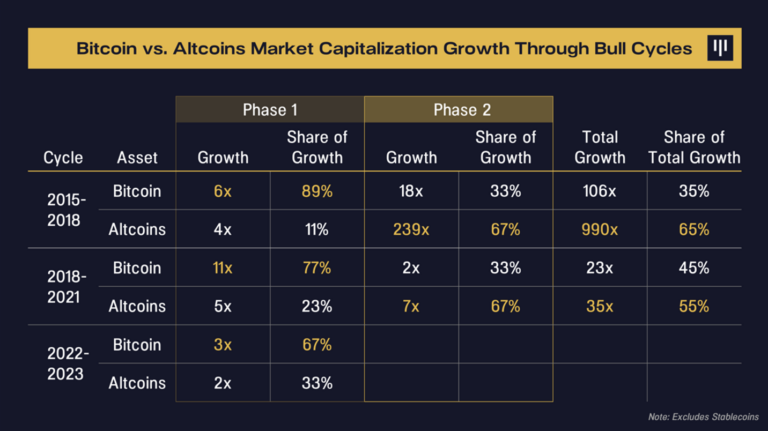
Coming to the macro bull cycle that began in 2023, Bitcoin has already witnessed a 3X growth while altcoins collectively witnessed only 2X. In the overall crypto market growth, BTC had a 67% share while alts had a 33% contribution.
Bitcoin and altcoin growth share

Bitcoin and altcoin growth share

This might change going forward since BTC is surprisingly losing the bullish momentum rather rapidly despite the Bitcoin halving coming up soon. This event might be BTC’s last shot at a bull run. Otherwise, the altcoins will likely see more growth this year.

Bitcoin loses dominance, literally

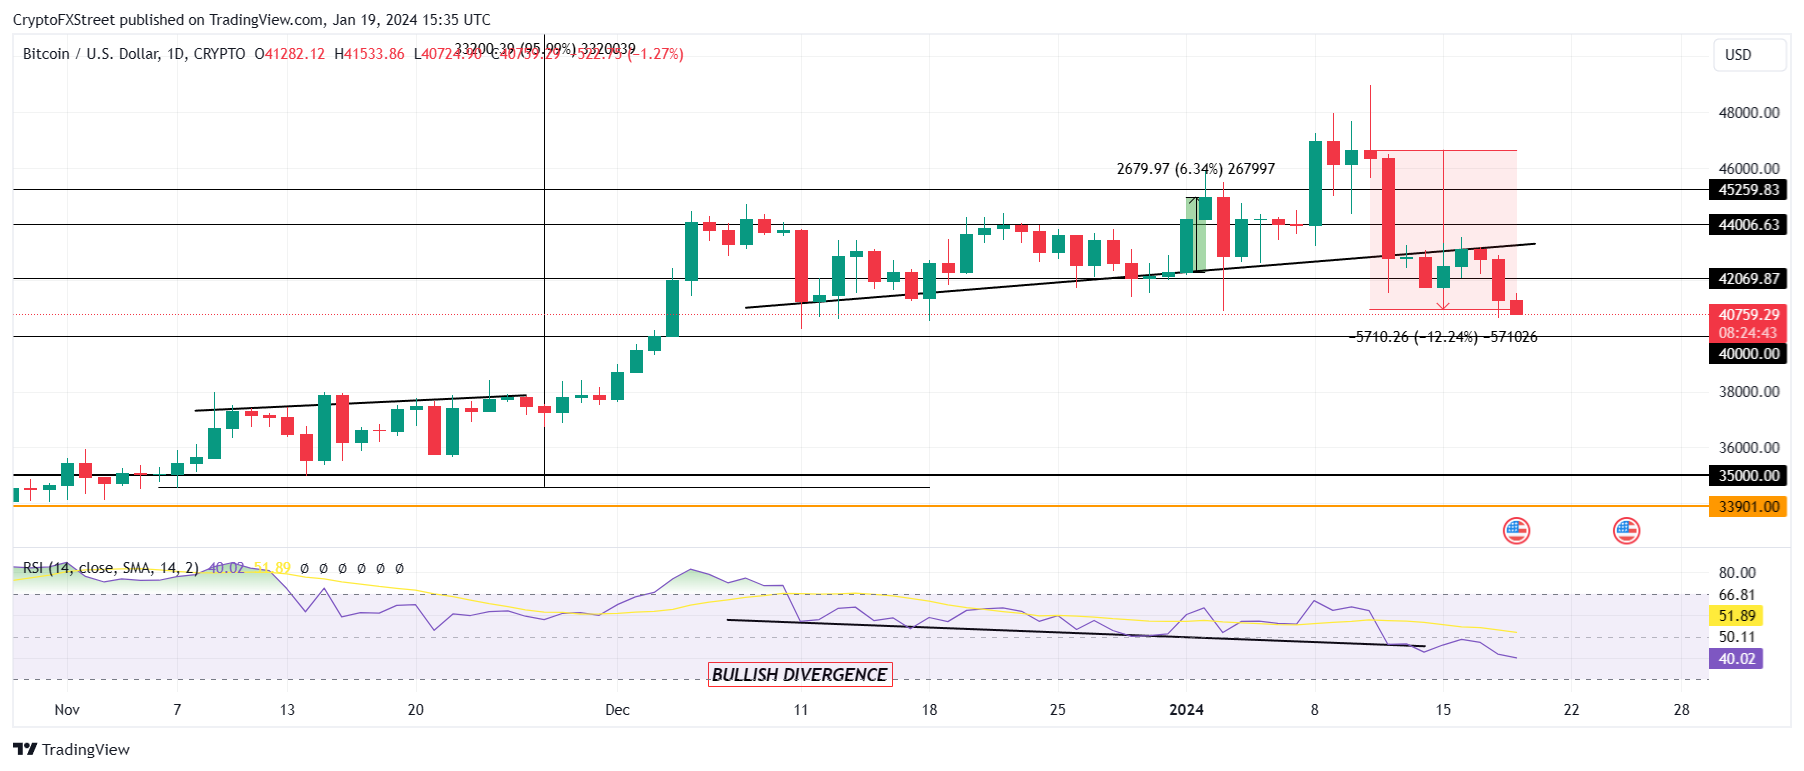
Bitcoin's dominance in the crypto market is coming down along with the price. At the time of writing, Bitcoin price can be seen hovering around $41,000, with the potential of further decline still on the cards. The Relative Strength Index (RSI) is below the neutral line, and the cryptocurrency failed the bullish divergence as well.
BTC/USD 1-day chart

BTC/USD 1-day chart

This resulted in Bitcoin’s dominance falling from over 54% to 50.9% at the moment. With the dominance being at a three-month low, the altcoins are already clearly taking over, commanding the other 50%. If this dominance falls below 50%, BTC might be on track to being surpassed by alts.

Bitcoin dominance 

Bitcoin dominance 

This could also result in the Bitcoin price falling through the $40,000 psychological support level and creating a new year-to-date low of around $35,000. When that happens, it is completely dependent on the response of the market to the halving event.

Disclaimer: For information purposes only. Past performance is not indicative of future results.
placeholder
Crude Oil Price Forecast: Escalating US-Iran Tanker Attacks and Strait of Hormuz Risks Push Brent to $120? International oil prices continued to climb on Monday, extending their strong performance from the previous week.As military confrontations between the U.S. and Iran heat up again in and
Author  TradingKey
8 hours ago
International oil prices continued to climb on Monday, extending their strong performance from the previous week.As military confrontations between the U.S. and Iran heat up again in and
placeholder
Hot August jobs report reignites Fed-hike bets; S&P 500 slips below 7,700 — what to watch before the September FOMCAugust nonfarm payrolls surged to 162,000, three times the consensus, pushing CME FedWatch odds of a September 25-bp hike to 58.4% and dragging the S&P 500 below 7,700. CPI, PPI and the Sept 15-16 FOMC decision now set the tone for US stocks.
Author  Irene Q.
12 hours ago
August nonfarm payrolls surged to 162,000, three times the consensus, pushing CME FedWatch odds of a September 25-bp hike to 58.4% and dragging the S&P 500 below 7,700. CPI, PPI and the Sept 15-16 FOMC decision now set the tone for US stocks.
placeholder
Today’s Market Recap: Nonfarm Payrolls Far Exceed Expectations, Fed Rate Hike Expectations Heat Up, Micron Surges 6% Against the Trend, SanDisk Jumps Over 10%Tracking Market TrendsTradingKey - On September 4, Eastern Time, the three major US stock indices closed lower across the board. US August non-farm payrolls data far exceeded market expectations, rein
Author  TradingKey
17 hours ago
Tracking Market TrendsTradingKey - On September 4, Eastern Time, the three major US stock indices closed lower across the board. US August non-farm payrolls data far exceeded market expectations, rein
placeholder
Top 3 Price Prediction: Bitcoin, Ethereum, Ripple – BTC, ETH and XRP await US NFP for next directional moveBitcoin (BTC), Ethereum (ETH) and Ripple (XRP) extend their weekly gains on Friday as traders await the US Nonfarm Payrolls (NFP) report for the next directional catalyst.
Author  FXStreet
Sep 04, Fri
Bitcoin (BTC), Ethereum (ETH) and Ripple (XRP) extend their weekly gains on Friday as traders await the US Nonfarm Payrolls (NFP) report for the next directional catalyst.
placeholder
Yen hits one-month high on BOJ September-hike bets; AUD/JPY cracks support as carry unwindsUSD/JPY has tumbled from the 160 area to a one-month low near 155.2 in two sessions as Bank of Japan hike bets for the Sept 17-18 meeting intensify. AUD/JPY has broken below 112.7, flagging carry-trade stress. A test of 155.21 - and then 153 - is now in focus.
Author  Suzie
Sep 04, Fri
USD/JPY has tumbled from the 160 area to a one-month low near 155.2 in two sessions as Bank of Japan hike bets for the Sept 17-18 meeting intensify. AUD/JPY has broken below 112.7, flagging carry-trade stress. A test of 155.21 - and then 153 - is now in focus.
Related Instrument
goTop
quote