

Ethereum Q2 insights combined with ETH rounding bottom indicates potential rally
- Ethereum clocked nine years today after overcoming several challenges and implementing key network upgrades.
- Glassnode's Ethereum Q2 insights indicate that ETH may have a productive Q3 ahead.
- Ethereum is forming a rounding bottom on the daily chart, indicating a potential bullish reversal.
Ethereum is down 1.5% on Tuesday despite several market participants acknowledging its ninth anniversary. Meanwhile, Glassnode shared key ETH Q2 insights that may prove beneficial as the market takes shape in Q3.
Daily digest market movers: ETH birthday, Q2 insights
Ethereum clocked nine years today after the Mainnet launch on July 30, 2015, when its first block was mined.
Happy 9th birthday, Ethereum!
— vitalik.eth (@VitalikButerin) July 30, 2024
Looking forward to seeing what the next decade brings. pic.twitter.com/bXq56mIff7
Since then, Ethereum has grown to a whopping market capitalization of $225.5 billion, implementing several upgrades along the way, including:
- Smart contract introduction
- The DAO hack and Hard Fork
- The Merge (Transition to Proof of Stake)
- Introduction of Layer 2 scaling solutions
- Shanghai Upgrade (Enabled withdrawal of staked ETH)
- Dencun upgrade (Introduced blob and reduced gas fees)
Upcoming upgrade includes Pectra, which will increase the limit of maximum number of staked ETH per individual validator from 32 ETH to 2,048 ETH and enable addresses to become smart contracts temporarily.
Meanwhile, in a recent report, Glassnode and Coinbase shared insights on how Ethereum has fared in the current market cycle and Q2 2024:
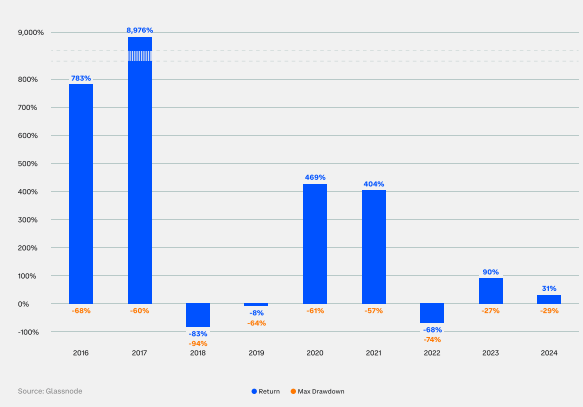
- ETH's price has risen by 240% since reaching the current cycle's low in November. According to the report, the current market cycle is similar to the 2018-2022 cycle, when ETH reached a high of "6,000% from the cycle's low."
- ETH's 31% annual return and 29% drawdown in 2024 are quite tiny compared to returns and drawdowns that marked the peak and exhaustion of previous cycles. Hence, ETH may have more room for price growth.
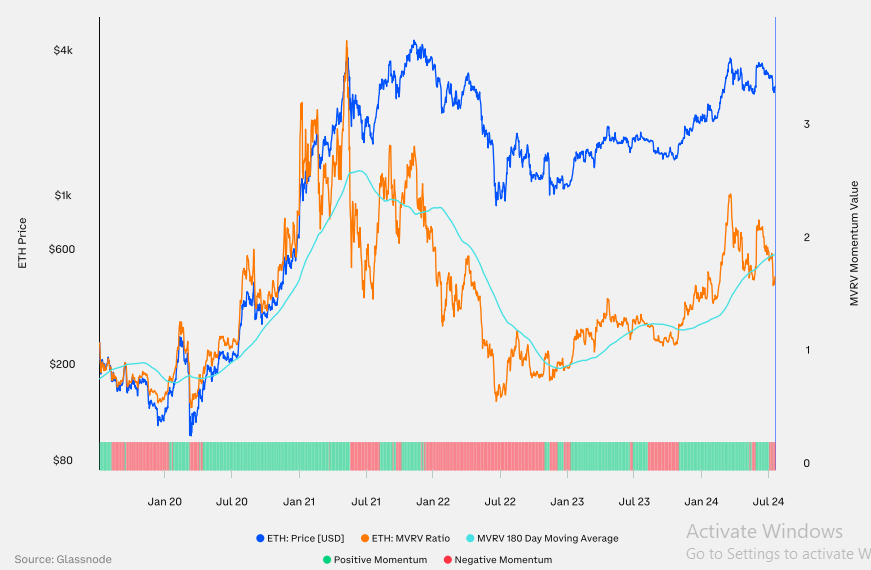
- ETH's Market Value to Realized Value (MVRV) broke below its six-month Simple Moving Average (SMA). This means that most investors acquired large volumes of ETH below its current market price, indicating a potential market transition point. A break above the six-month SMA would bring several of these coins into profit.
- In Q2, the total ETH staked increased by 5% to about 33 million ETH.
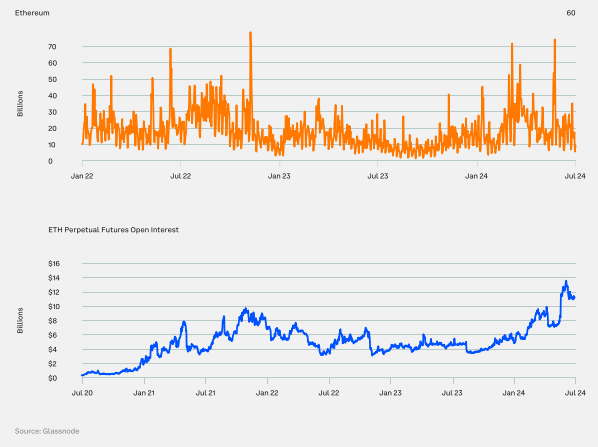
- Ethereum perpetual futures volume decreased by 8% in Q2 after rising by 69% in Q1 — probably due to choppy price movements. On the other hand, ETH's Open Interest (OI) rose to a new all-time high of nearly $14 billion in Q2, while the average daily OI increased by 37%.
These insights and the launch of spot Ethereum ETFs show ETH may have a productive Q3 ahead.
ETH technical analysis: Ethereum is bullish in the long term
Ethereum is trading around $3,268, down 1.5% on the day. The slight decline has seen ETH sustain $30 million in liquidations, with long and short liquidations accounting for $24.5 million and $5.8 million, respectively.
ETH is bearish on the daily chart as the 50-day SMA is above its price and falling, indicating a possible resistance to upward price movement.
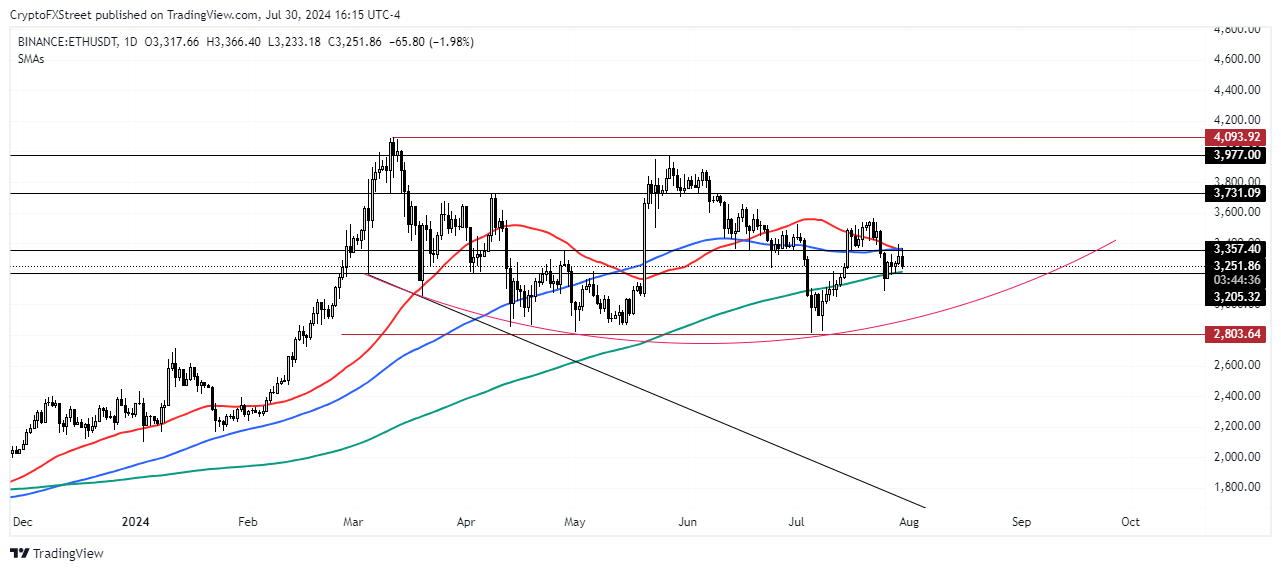
ETH/USDT Daily chart
However, Ethereum is forming a rounding bottom on the daily chart, which is considered a bullish reversal. If the upward trend continues, ETH could challenge its yearly resistance of $4,093, reached on March 13. On the downside, ETH could find support around the $2,803 to $2,852 range.
In the short term, ETH could rise to $3,368 where there's a liquidation wall of $25.72 million.
Ethereum FAQs
Ethereum is a decentralized open-source blockchain with smart contracts functionality. Serving as the basal network for the Ether (ETH) cryptocurrency, it is the second largest crypto and largest altcoin by market capitalization. The Ethereum network is tailored for scalability, programmability, security, and decentralization, attributes that make it popular among developers.
Ethereum uses decentralized blockchain technology, where developers can build and deploy applications that are independent of the central authority. To make this easier, the network has a programming language in place, which helps users create self-executing smart contracts. A smart contract is basically a code that can be verified and allows inter-user transactions.
Staking is a process where investors grow their portfolios by locking their assets for a specified duration instead of selling them. It is used by most blockchains, especially the ones that employ Proof-of-Stake (PoS) mechanism, with users earning rewards as an incentive for committing their tokens. For most long-term cryptocurrency holders, staking is a strategy to make passive income from your assets, putting them to work in exchange for reward generation.
Ethereum transitioned from a Proof-of-Work (PoW) to a Proof-of-Stake (PoS) mechanism in an event christened “The Merge.” The transformation came as the network wanted to achieve more security, cut down on energy consumption by 99.95%, and execute new scaling solutions with a possible threshold of 100,000 transactions per second. With PoS, there are less entry barriers for miners considering the reduced energy demands.
Recommended Articles


