


Ripple (XRP) Price Boosted by Upcoming August Token Unlock
Blockchain payment project Ripple will unlock 1 billion XRP tokens on August 1. This is part of its usual monthly practice based on its objective to put 55 billion XRP tokens in escrow over several years.
At press time, the unlock tokens will cost $603 million. Interestingly, as the event approaches, the XRP price is surprisingly increasing.
Interest in Ripple Surges, Profit-Taking Drops
The monthly XRP unlocks date back to 2017. According to Ripple, the mechanism is part of its mission to alleviate the pressure on the token, especially as it has an extremely vast supply. Sometimes, the unlock brings about a stalemate in XRP’s price or a slight drop.
Therefore, if the price continues to rise for the next two days, the August one may differ. The daily on-chain transaction volume in profit supports this bias. This volume gauges the number of transactions involved in realized profits.
Typically, an increase in realized profits puts downward pressure on the price of a cryptocurrency. However, for XRP, it is different because, on July 29, the volume in profit was over 480 million. But as of this writing, it is two times less, indicating that profit-taking has decreased.
Read More: Everything You Need To Know About Ripple vs SEC
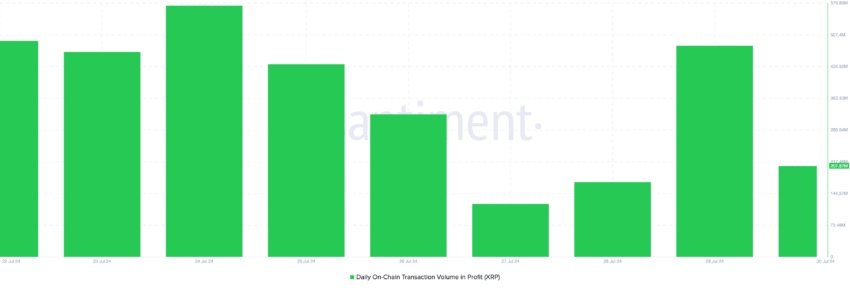 XRP On-Chain Transaction Volume in Profit. Source: Santiment
Low profit-taking may offer price stability. Hence, if token holders refrain from booking gains in the coming days, XRP’s price may trade higher than $0.63.
Additionally, Open Interest in the Ripple native token has increased to its highest level since April 16. At press time, the OI, as it is fondly called, is $667.68 million. Open Interest refers to the sum of the value of open contracts in the market.
Thus, the hike indicates rising net positioning and speculative activity around XRP. OI also impacts price, as an increase alongside a price upswing indicates aggressive buyers. Should the value continue to jump, it may offer an impulsive breakout for XRP.
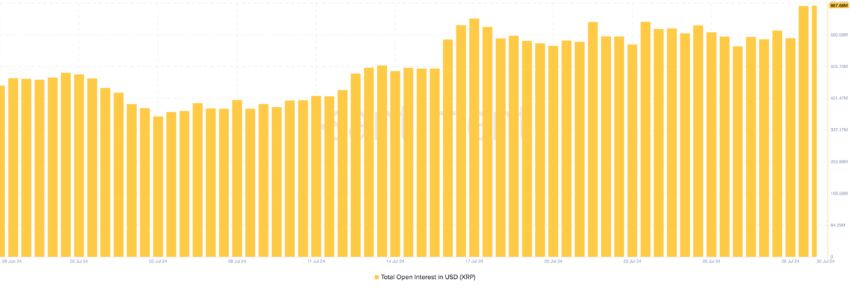 XRP Open Interest. Source: Santiment
XRP Price Prediction: A Rise Against the Odds
According to the daily chart, XRP formed a symmetrical triangle, which was crucial to the recent engulfing candlestick, which quickly pushed the price up from $0.59 to $0.60. A symmetrical triangle appears when two trendlines with equal opposite slopes converge.
Depending on the direction of the cryptocurrency, this narrow pattern may result in a breakdown or breakout. For XRP, the latter is the case, indicating that bulls control the prevailing trend. Interestingly, the price action contrasts with the trend of Bitcoin (BTC) and other cryptos.
The last time this happened was in early July, and XRP produced 40% within a few days. At press time, the Relative Strength Index (RSI) is 66.94, indicating that the momentum around the token is bullish.
Should this continue, XRP’s price may surpass $0.65 in the short term. Further, if August brings good tidings, the token’s price could attempt to reach its yearly high of $0.72.
Read More: Ripple (XRP) Price Prediction 2024/2025/2030
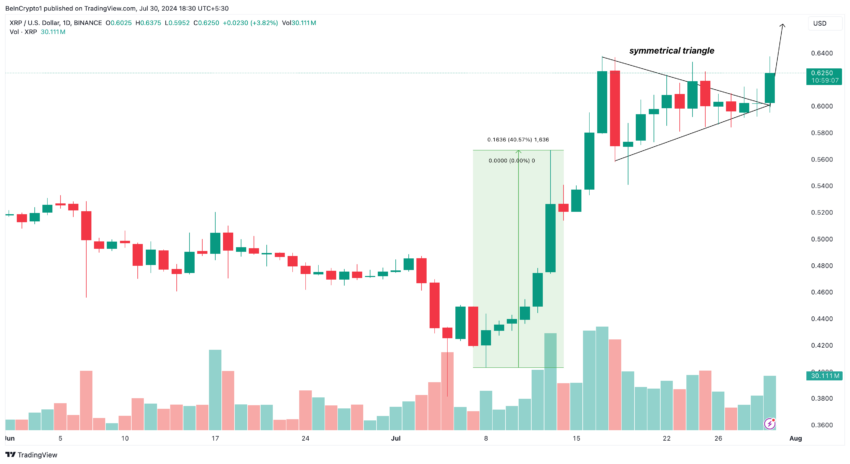 XRP Daily Analysis. Source: TradingView
There have also been some analyst predictions on X. Notably, BeInCrypto picked one from pseudonymous trader Mikybull, who opined that XRP displays signs similar to the 2017 bull run.
“XRP displays significant technical signs that occurred in 2017 and led to massive gains afterward. Historically, the chart always precedes the news,” he explained.
However, if profit-taking occurs, the token may not be able to sustain this prediction. If that happens, the cryptocurrency’s price may decline to $0.60.
Recommended Articles


