


Bitcoin price declines as US Government transfers funds worth $2 billion
- The US government moved $2 billion worth of Bitcoin from Silk Road's confiscated funds.
- Data from Lookonchain shows that FalconX has sold 1,000 BTC, amounting to $69.52 million, on the Binance exchange.
- On-chain data shows that the Coinbase Premium Index falls below the 14-day Simple Moving Average, suggesting a slight increase in sell pressure.
Bitcoin (BTC) stabilizes around the $68,000 level on Tuesday after failing to close above $70,000 the day before. The US government moved $2 billion worth of Bitcoin from Silk Road's confiscated funds on Monday. Additionally, data from Lookonchain reveals that FalconX sold 1,000 BTC, totaling $69.52 million, on the Binance exchange. On-chain data indicates that the Coinbase Premium Index has dropped below the 14-day Simple Moving Average, signaling a slight uptick in selling pressure.
Daily digest market movers: Bitcoin drops as US government transfers funds worth $2 billion
- According to data from Arkham Intelligence, the US government transferred $2 billion worth of Silk Road confiscated Bitcoin funds on Monday and has split them into two addresses:
- 10,000 BTC ($669.35M): bc1qlap8hkt9genaljz5nt2zlehhudx63zlahr2zek
- 19,800 BTC ($1.33B): bc1qngydl7hmgdtmuqjmtsyj3pcwszv0yn5mj6kz4c
- Arkham believes this represents a 10,000 BTC deposit to an institutional custody/service. The U.S. Government holds a total of $12.65 billion worth of Bitcoin. This transfer of funds likely sparked FUD (Fear, Uncertainty, Doubt) among traders, potentially contributing to Bitcoin's price decline.
UPDATE: The U.S. Government has split the $2B Bitcoin into two addresses:
— Arkham (@ArkhamIntel) July 29, 2024
10,000 BTC ($669.35M): bc1qlap8hkt9genaljz5nt2zlehhudx63zlahr2zek
19,800 BTC ($1.33B): bc1qngydl7hmgdtmuqjmtsyj3pcwszv0yn5mj6kz4c
We believe this represents a 10,000 BTC deposit to an institutional… https://t.co/0aULBXGd8P pic.twitter.com/RTwtaqvMmM
- Data from Lookonchain reveals that FalconX, the largest digital asset prime brokerage for leading institutions, deposited 1,000 BTC worth $69.52 million into the Binance exchange. Shortly after, the price of BTC surged past $70,000, only to drop below $68,000.
- This move suggests that institutional investors are gradually offloading their Bitcoin holdings. If this trend persists, BTC's price could decline further.
4 hours ago, #FalconX deposited 1,000 $BTC($69.52M) into #Binance.
— Lookonchain (@lookonchain) July 29, 2024
After that, the price of $BTC broke through $70,000 and quickly plummeted below $68,000!
Address:
bc1q42kvqt0e3f27qhd2ucnprarl5ywpuj7tu0h9v2 pic.twitter.com/L211Rm7kni
- According to Coinglass Bitcoin Spot ETF data, inflows of $122.10 million occurred on Monday. Monitoring these ETFs' net flow data is crucial for understanding market dynamics and investor sentiment. The combined Bitcoin reserves held by the 11 US spot Bitcoin ETFs stand at $52.77 billion.

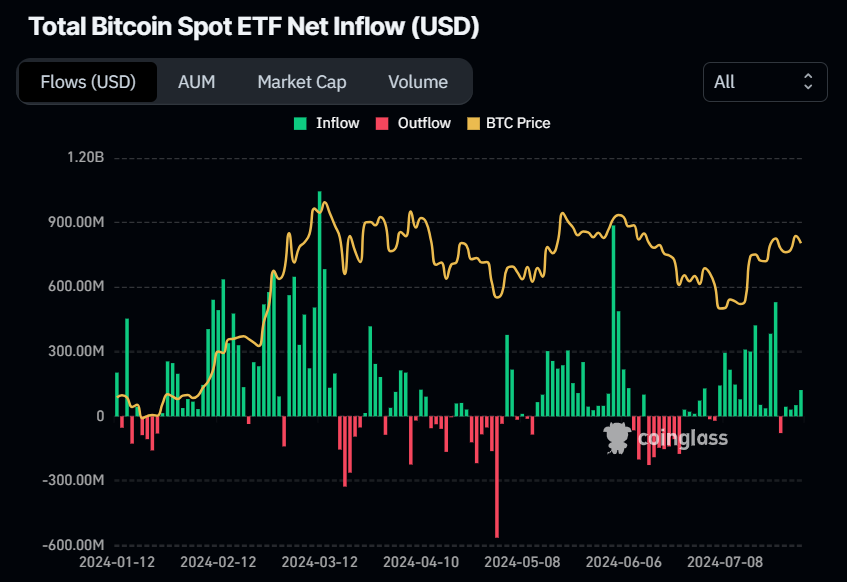
Bitcoin Spot ETF Net inflow (USD) chart
- Economist and gold advocate Peter Schiff believes the Biden administration will sell every bitcoin before Trump takes office.
- He said, "If Trump really intended to use seized Bitcoin to start a US "strategic" reserve, he'd have kept his intention a secret until he was actually in office. Now that the Biden administration is wise to his plan, they'll make sure to sell every Satoshi before Trump takes office."The US government's transfer of $2 billion in BTC on Monday has intensified this speculation.
If #Trump really intended to use seized #Bitcoin to start a U.S. "strategic" reserve, he'd have kept his intention a secret until he was actually in office. Now that the #Biden administration is wise to his plan, they'll make sure to sell every Satoshi before Trump takes office.
— Peter Schiff (@PeterSchiff) July 29, 2024
- According to CryptoQuant, the Coinbase Premium Index (CPI) signifies the discrepancy between Coinbase Pro's USD and Binance's USDT pair prices. When the CPI dips below its 14-day Simple Moving Average (SMA), as observed throughout 2024, Bitcoin tends to undergo price corrections. Since the approval of Spot ETFs in the US, CPI has proven to be a pivotal leading indicator for price movements.
- Utilizing CPI alongside SMA 14 has proven particularly effective for monitoring short-term trends. With CPI at -0.008 and SMA 14 at 0.020, it suggests heightened selling pressure within the U.S. market.
-638579249942788978.png)
Bitcoin Coinbase Premium Index (SMA 14) chart
Technical analysis: BTC faces rejection around the $70,000 mark
Bitcoin price retested the daily support at $64,737 on July 25 and rallied 4% the next three days. Currently, it faced rejection at the weekly resistance level of $69,648 on Monday and trades slightly down by 0.11% at $66,703 on Tuesday.
If the daily support at $66,406 and the ascending trendline in the daily chart holds, BTC could rise 10% to retest its June 7 high of $71,997.
On the daily chart, the Relative Strength Index (RSI) and the Awesome Oscillator (AO) indicators are trading above their neutral levels of 50 and zero, respectively. This robust momentum signals a strong bullish sentiment in the market.
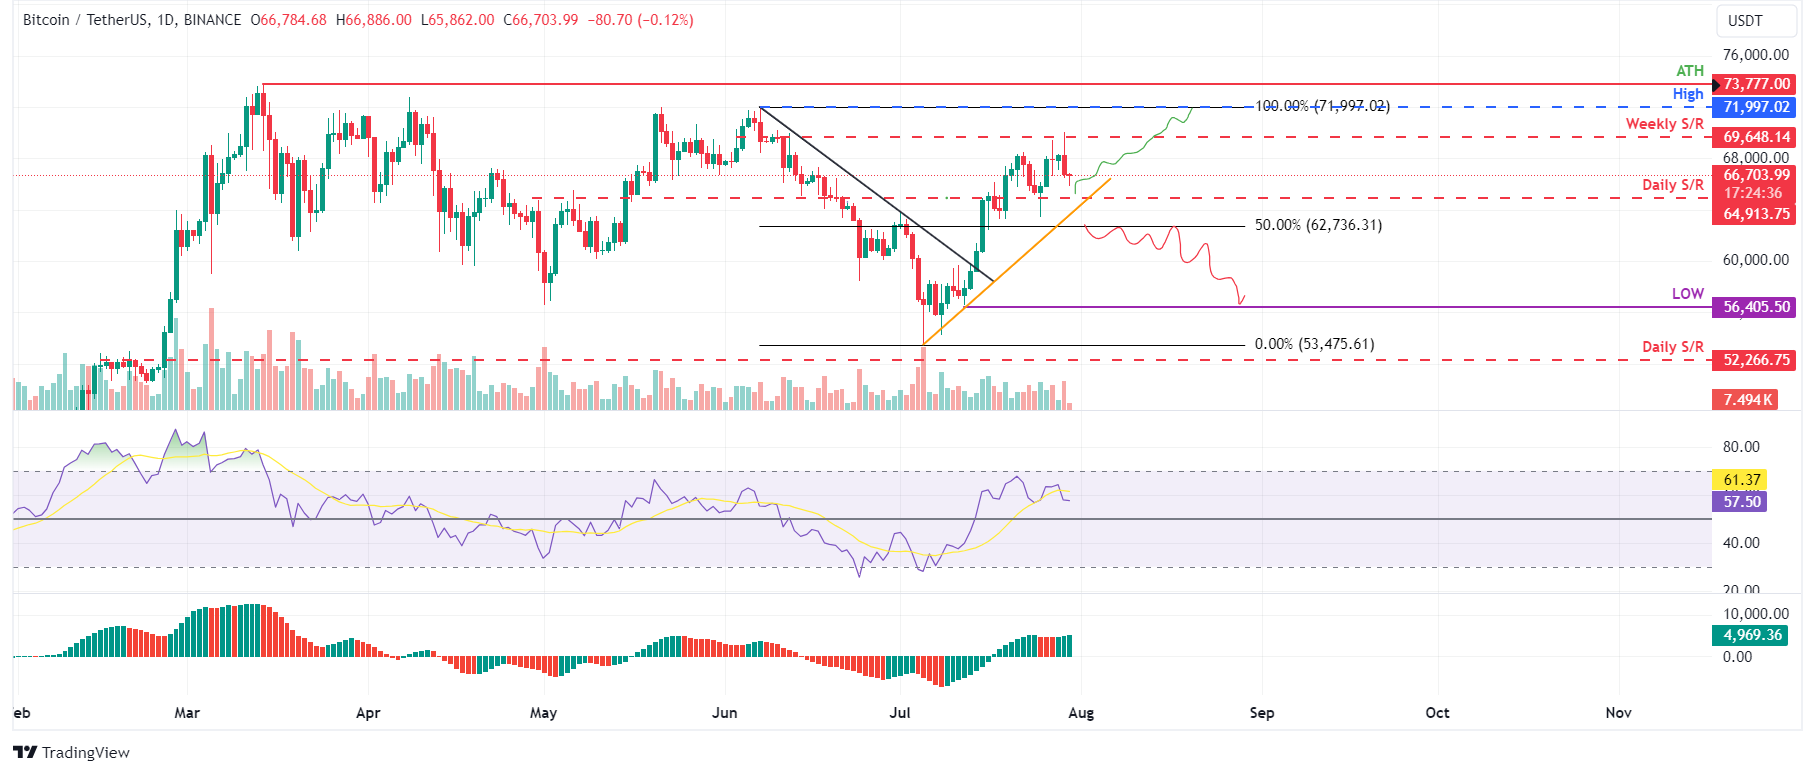
BTC/USDT daily chart
However, a close below $62,736 and a break below the ascending trendline would change the market structure from bullish to bearish by forming a lower low on the daily timeframe. Such a scenario might precipitate a 10% crash in Bitcoin's price to retest its July 12 low of $56,405.
Bitcoin, altcoins, stablecoins FAQs
Bitcoin is the largest cryptocurrency by market capitalization, a virtual currency designed to serve as money. This form of payment cannot be controlled by any one person, group, or entity, which eliminates the need for third-party participation during financial transactions.
Altcoins are any cryptocurrency apart from Bitcoin, but some also regard Ethereum as a non-altcoin because it is from these two cryptocurrencies that forking happens. If this is true, then Litecoin is the first altcoin, forked from the Bitcoin protocol and, therefore, an “improved” version of it.
Stablecoins are cryptocurrencies designed to have a stable price, with their value backed by a reserve of the asset it represents. To achieve this, the value of any one stablecoin is pegged to a commodity or financial instrument, such as the US Dollar (USD), with its supply regulated by an algorithm or demand. The main goal of stablecoins is to provide an on/off-ramp for investors willing to trade and invest in cryptocurrencies. Stablecoins also allow investors to store value since cryptocurrencies, in general, are subject to volatility.
Bitcoin dominance is the ratio of Bitcoin's market capitalization to the total market capitalization of all cryptocurrencies combined. It provides a clear picture of Bitcoin’s interest among investors. A high BTC dominance typically happens before and during a bull run, in which investors resort to investing in relatively stable and high market capitalization cryptocurrency like Bitcoin. A drop in BTC dominance usually means that investors are moving their capital and/or profits to altcoins in a quest for higher returns, which usually triggers an explosion of altcoin rallies.
Recommended Articles


