Dogecoin, Shiba Inu, PEPE, BONK erase nearly 3% value as meme coin category takes a hit

Source Fxstreet
  • Dogecoin, Shiba Inu, Pepe, and Bonk note a correction in their price on Thursday. 
  • Meme coins erased nearly 6% of their market capitalization on the day, amidst a market-wide correction in crypto prices. 
  • Trader activity is relatively low in DOGE, SHIB, and PEPE, and nearly all top meme coins have suffered a decline in social dominance. 

Meme coin market capitalization is down 6% on Thursday as the top three cryptocurrencies, Bitcoin, Ethereum, and XRP, are hit by a correction. CoinGecko data shows that the correction is market-wide.

Dogecoin (DOGE), Shiba Inu (SHIB), Pepe (PEPE), and Bonk (BONK) wipe out nearly 3% of their value on Thursday, as the correction hits the meme coin category. 

Meme coin category takes a hit in crypto market correction

Meme coin market capitalization shrunk by 6% in the last 24 hours, down to $51.50 billion per CoinGecko data. DOGE, SHIB, PEPE, and BONK prices have declined on Thursday. The four meme coins offer sidelined traders a “buy the dip” opportunity. 

DOGE, SHIB, and PEPE have noted a slowdown in trader activity, as active addresses declined, as seen on Santiment. Social dominance, a metric used to identify the percentage of mentions of an asset among crypto traders across social media platforms, remains low for all assets. 

DOGE

DOGE, SHIB, PEPE active addresses 

Dogecoin technical analysis
DOGE

DOGE/USDT daily chart 

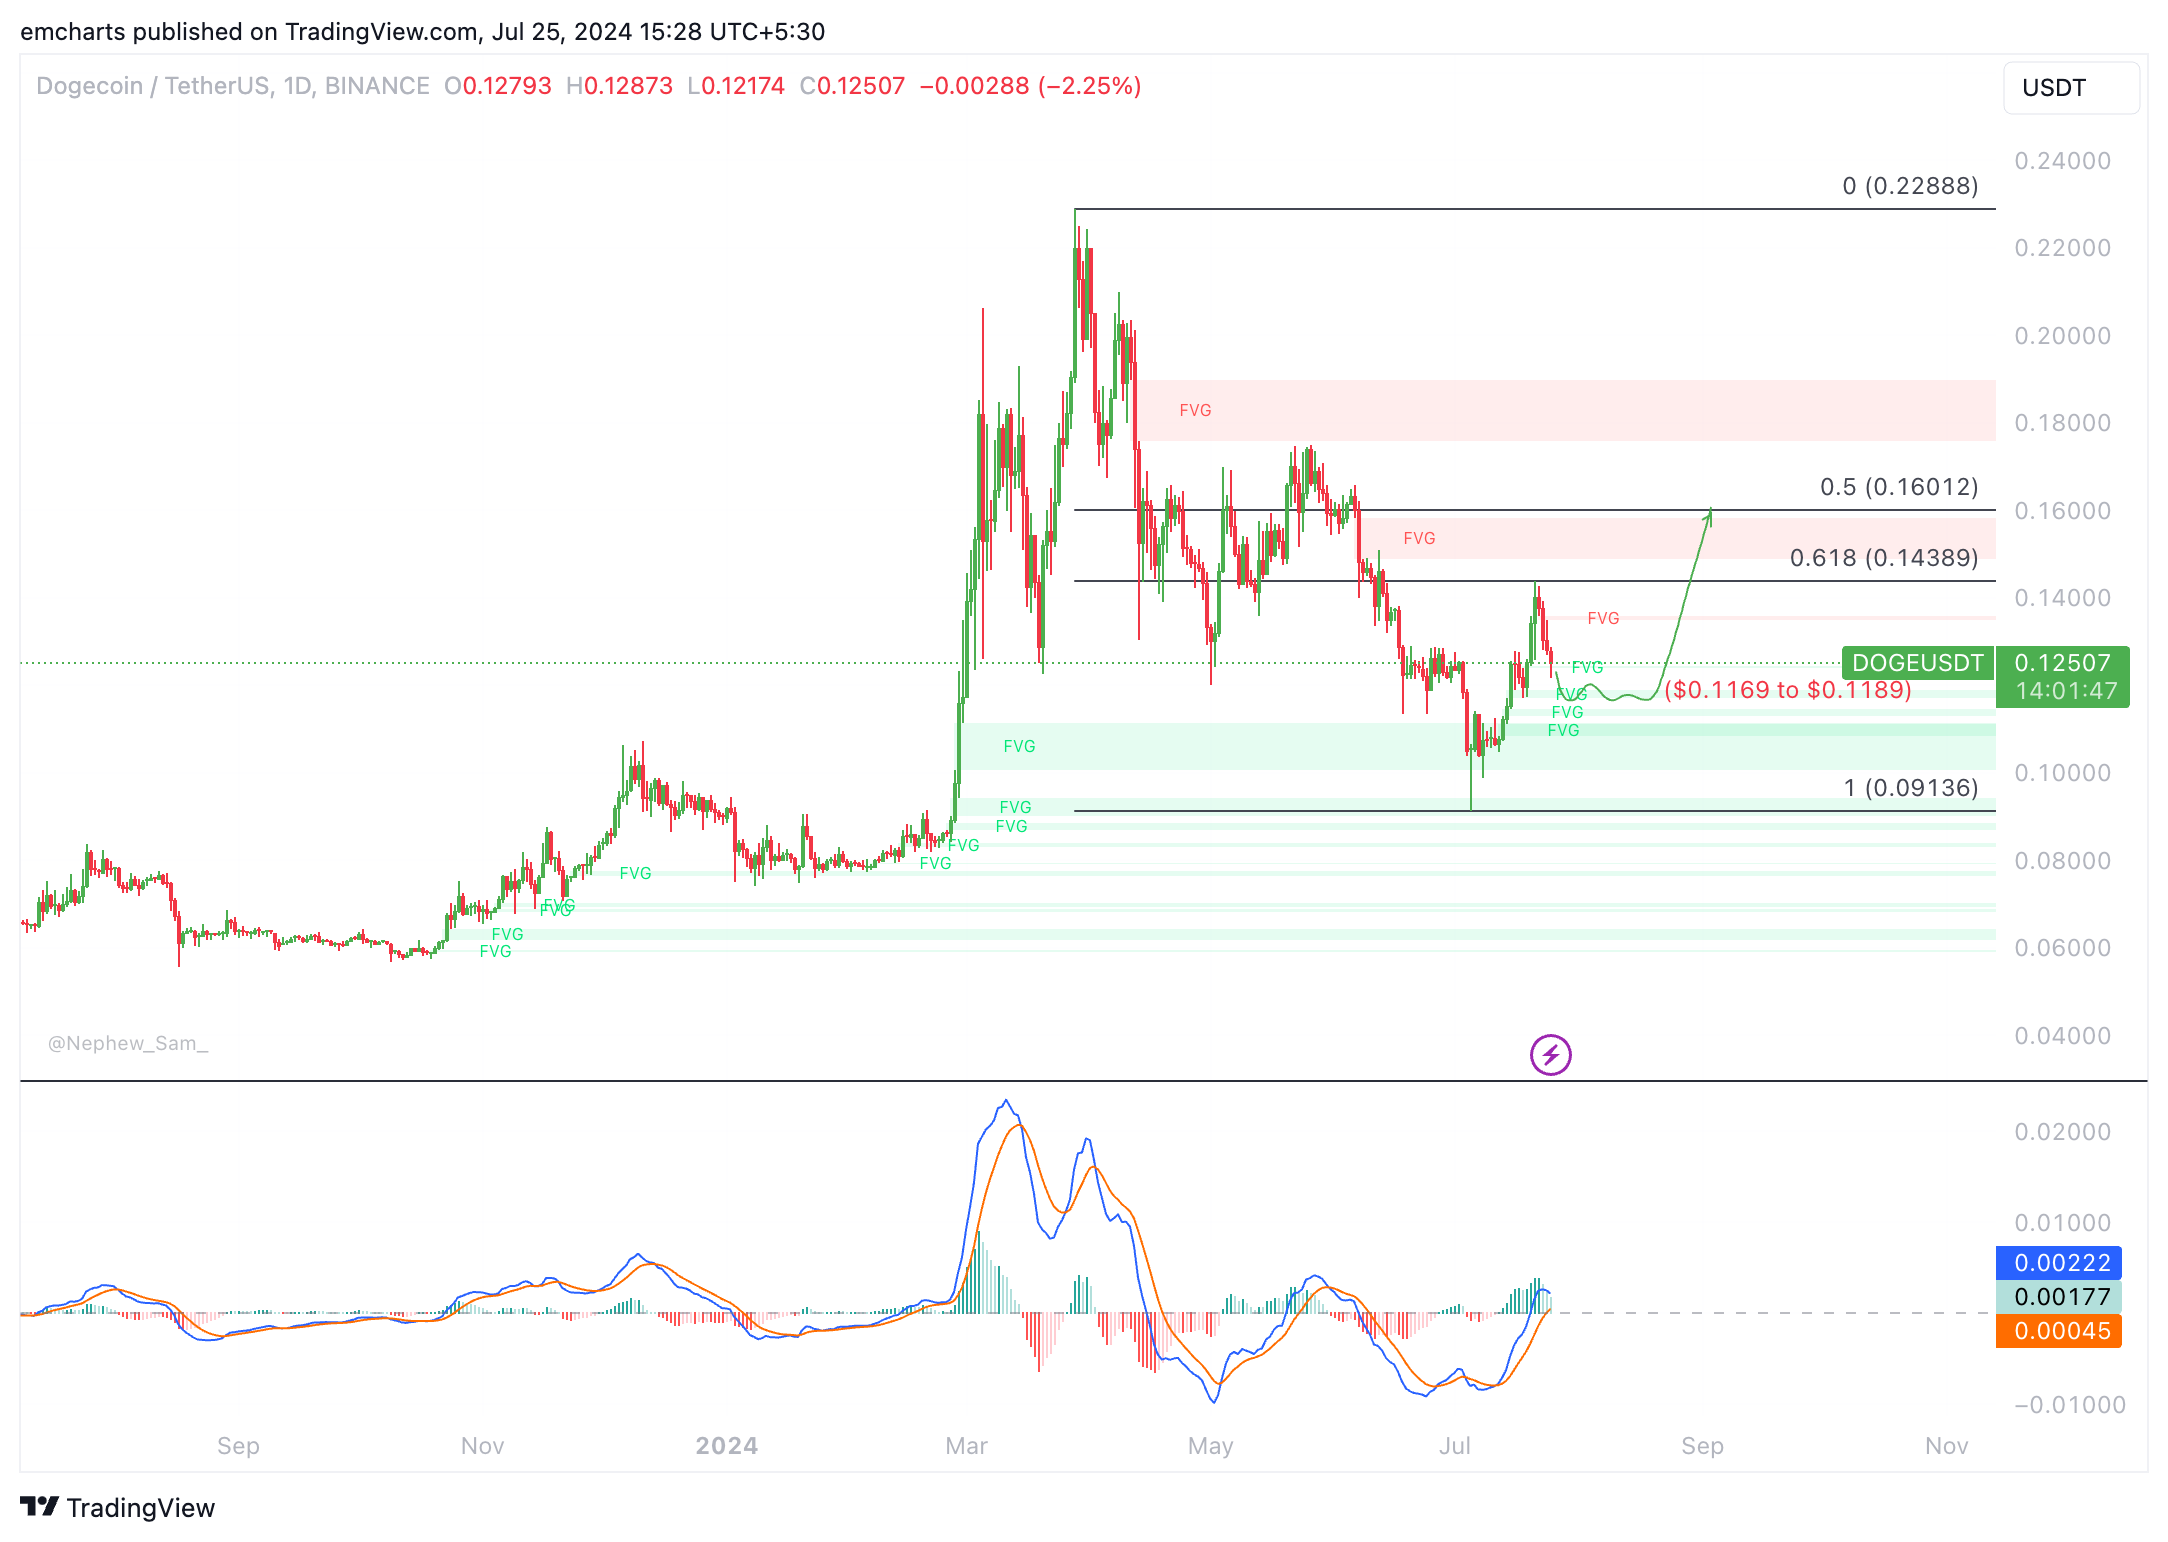
Dogecoin’s trend reversed, and the meme coin has been forming higher highs and higher lows since July 9. The meme coin could collect liquidity at the Fair Value Gap (FVG) between $0.1169 and $0.1189 and rally towards its target at $0.1601. This level represents the 50% Fibonacci retracement of the decline between the March 28 top of $0.2288 and the July 5 low of $0.0913. 

Key support levels: $0.1189, $0.1169, $0.0913

Key resistance levels: $0.1348, $0.1438, $0.1601

Shiba Inu technical analysis 
SHIB

SHIB/USDT daily chart

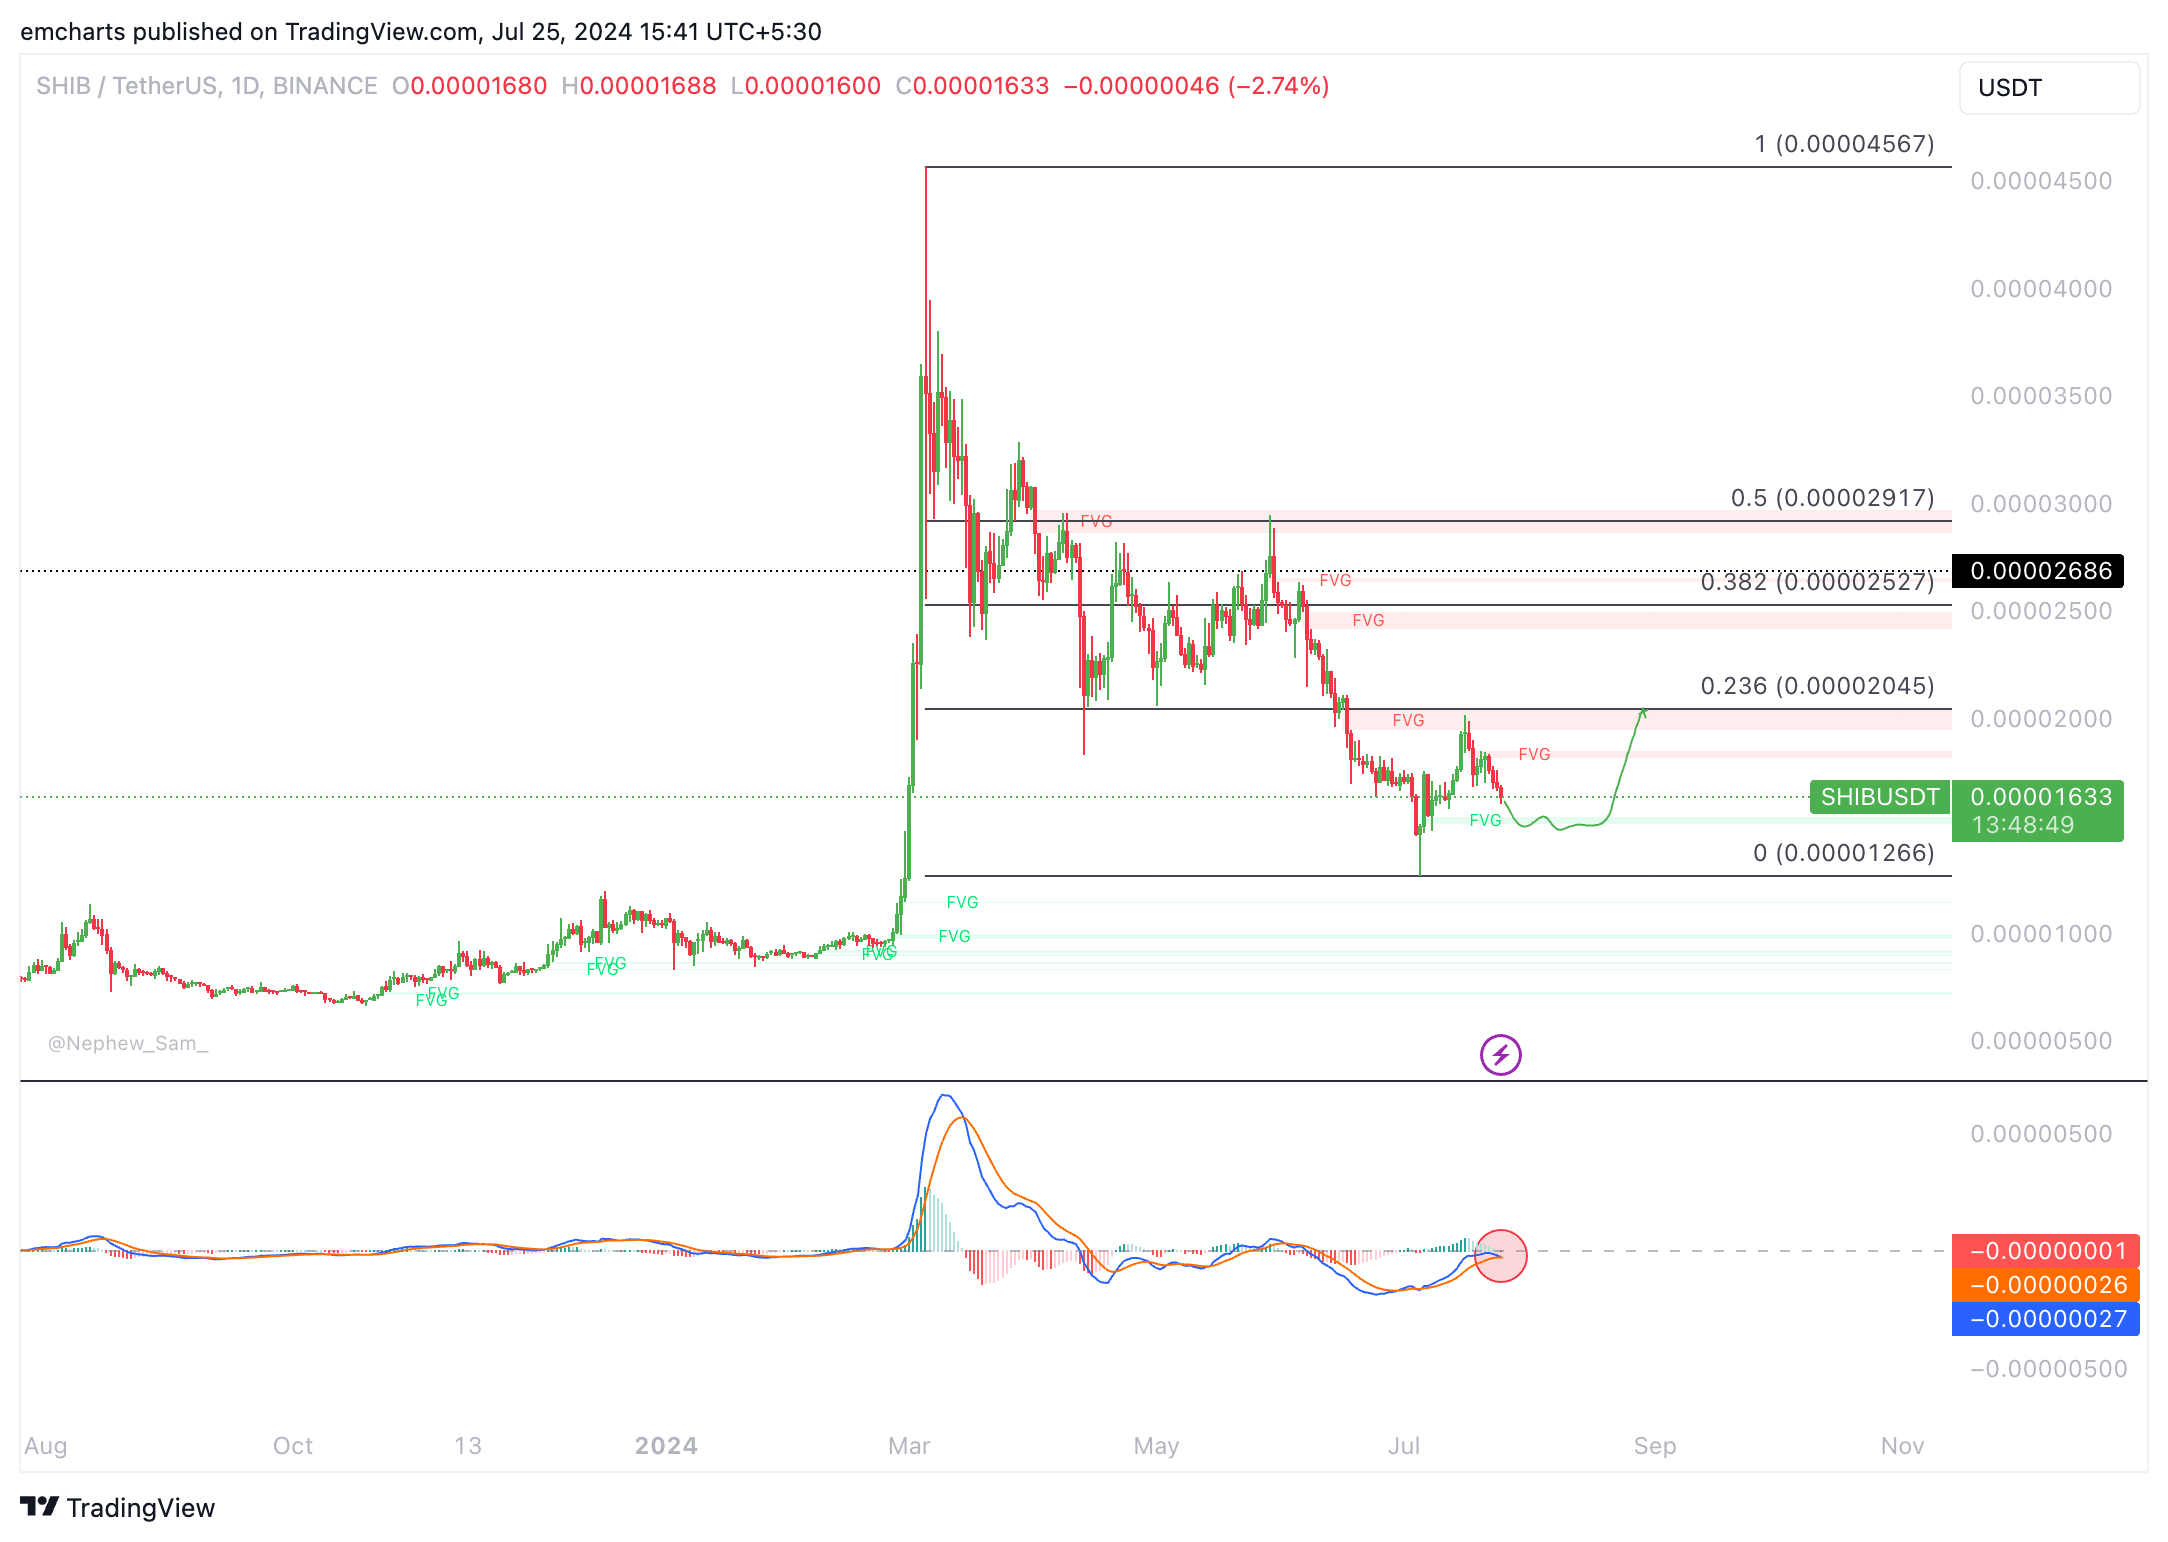
Shiba Inu is in a downward trend. The Moving Average Convergence Divergence (MACD) momentum indicator shows negative momentum in the SHIB price trend as the signal line is crossing above the MACD line, as seen in the SHIB/USDT daily chart. 

SHIB could dip into the Fair Value Gap (FVG) between $0.00001508 and $0.00001539 to collect liquidity before attempting another recovery. This marks a nearly 8% decline in SHIB price from the current level of $0.00001633. 

Key support levels: $0.00001539, $0.00001508, $0.00001266

Key resistance levels: $0.00001817, $0.000020, $0.00002045

Pepe technical analysis 
PEPE

PEPE/USDT daily chart 

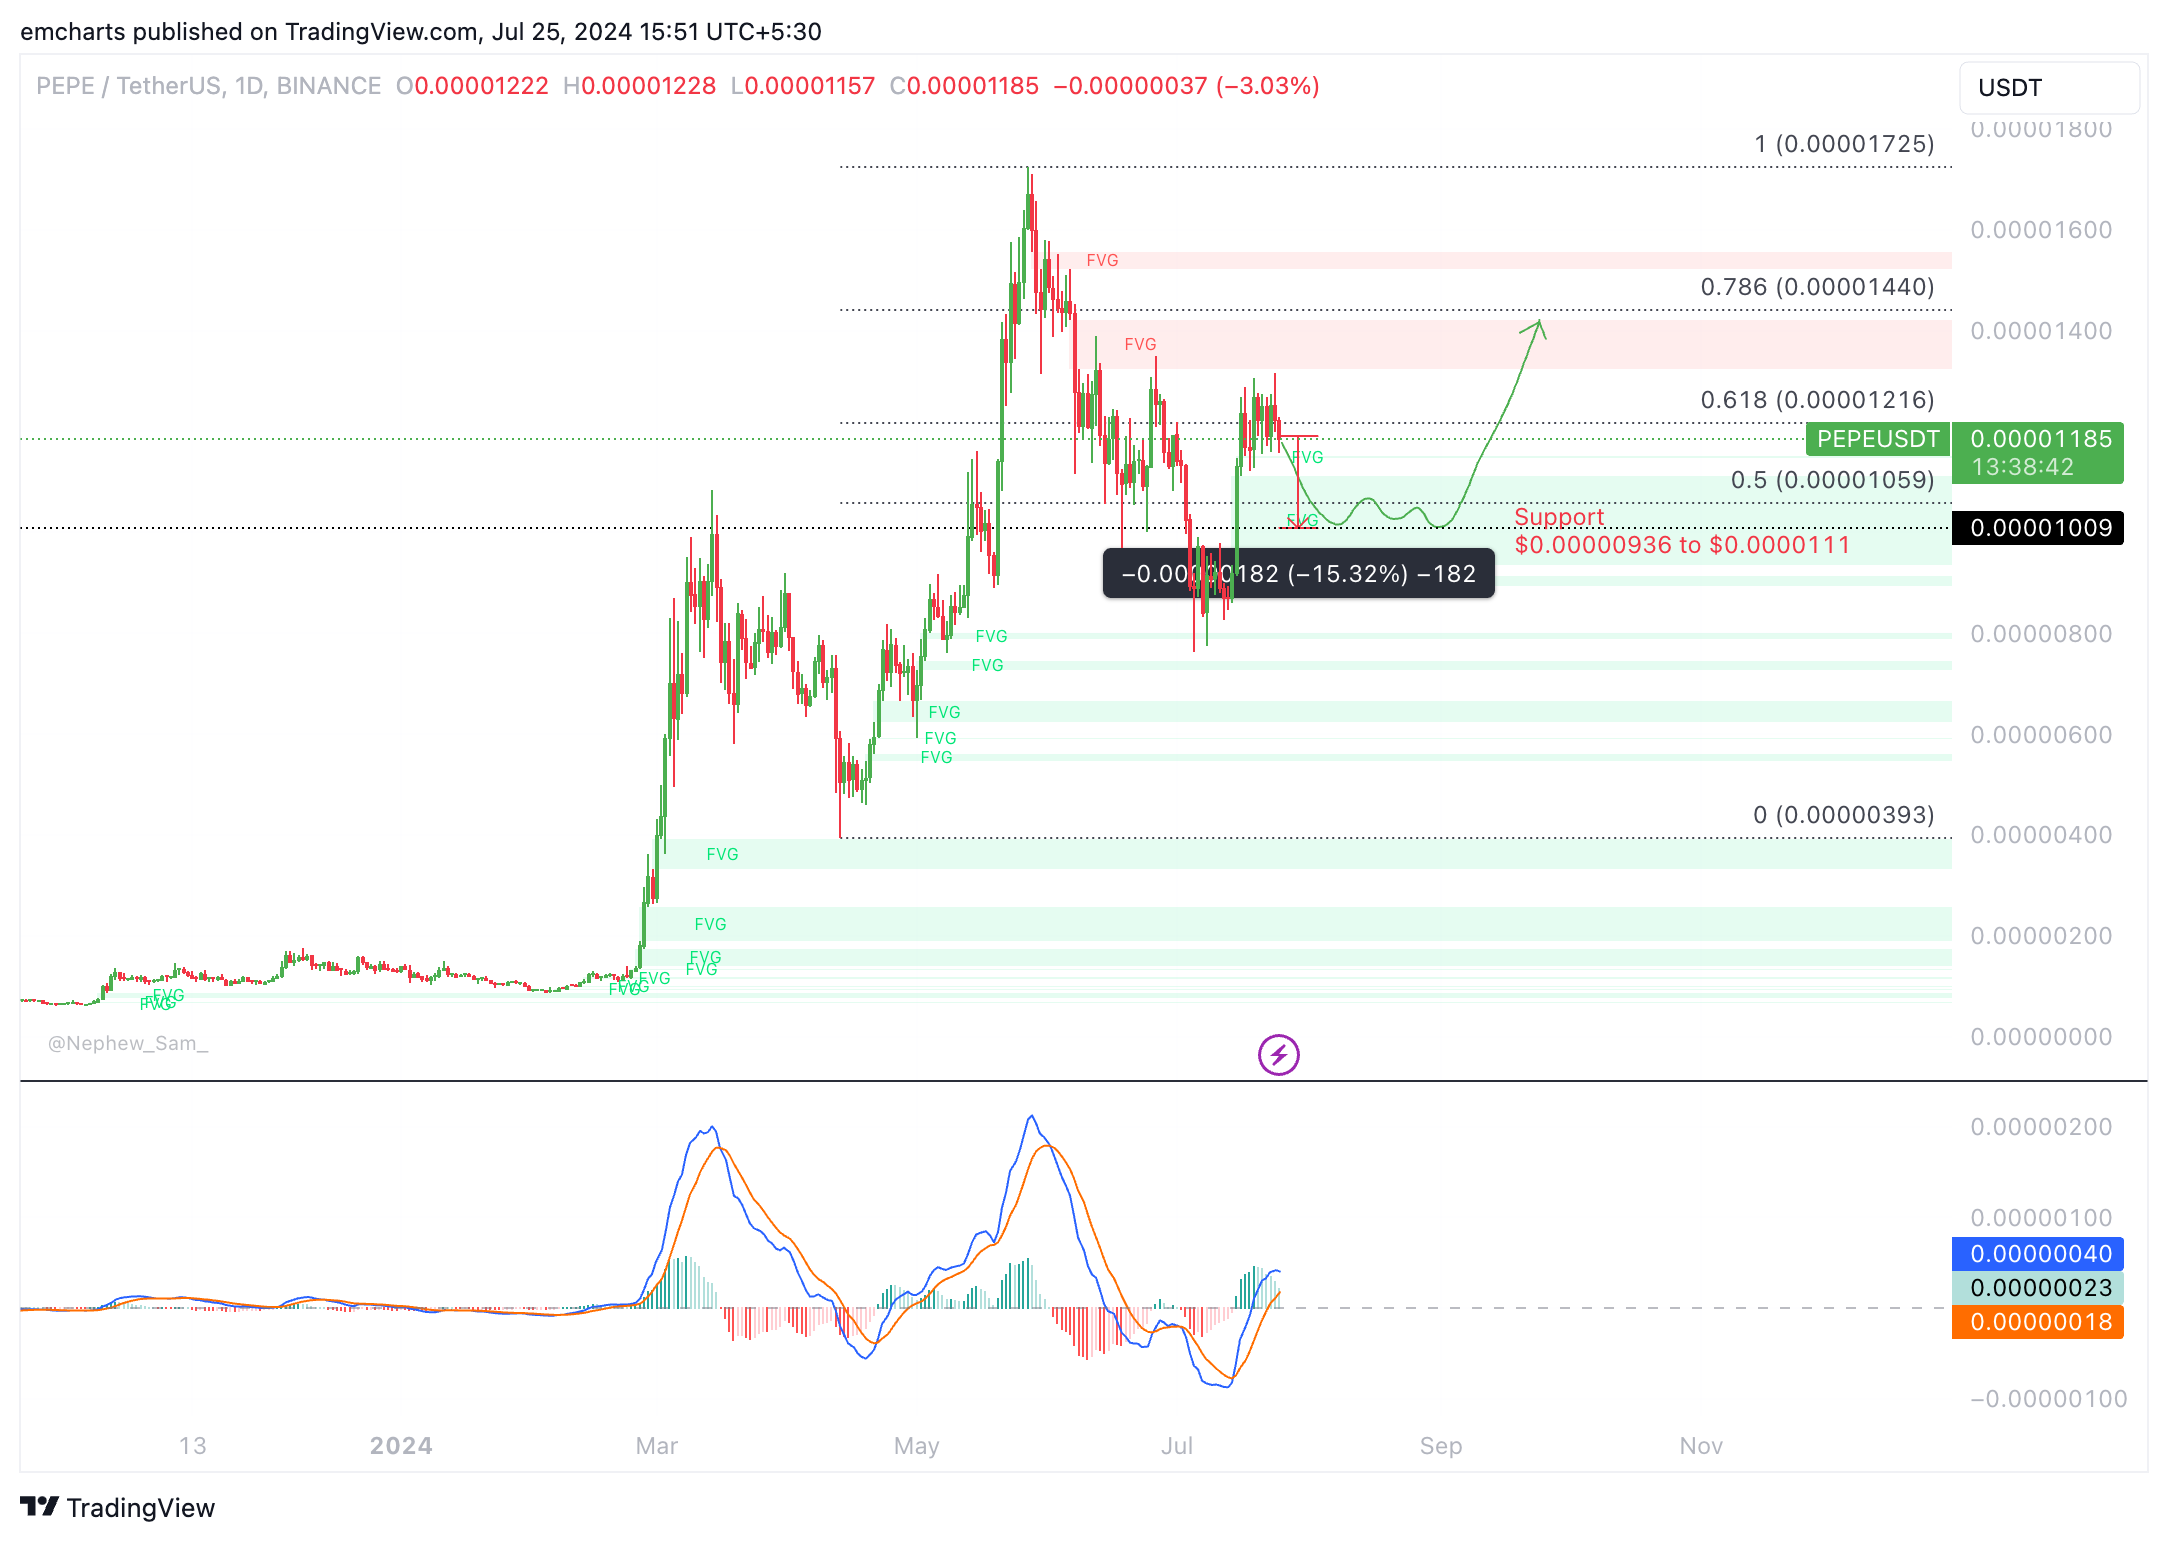
PEPE could dip into the Fair Value Gap (FVG) between $0.00000936 and $0.0000111 to collect liquidity before advancing higher towards $0.00001440, the 78.6% Fibonacci retracement of the rally from the April 13 low of $0.00000393 to the May 27 high of $0.00001725.

Key support levels: $0.0000111, $0.00001059, $0.00000936

Key resistance levels: $0.00001216, $0.00001440

Bonk technical analysis
BONK

BONK/USDT daily chart

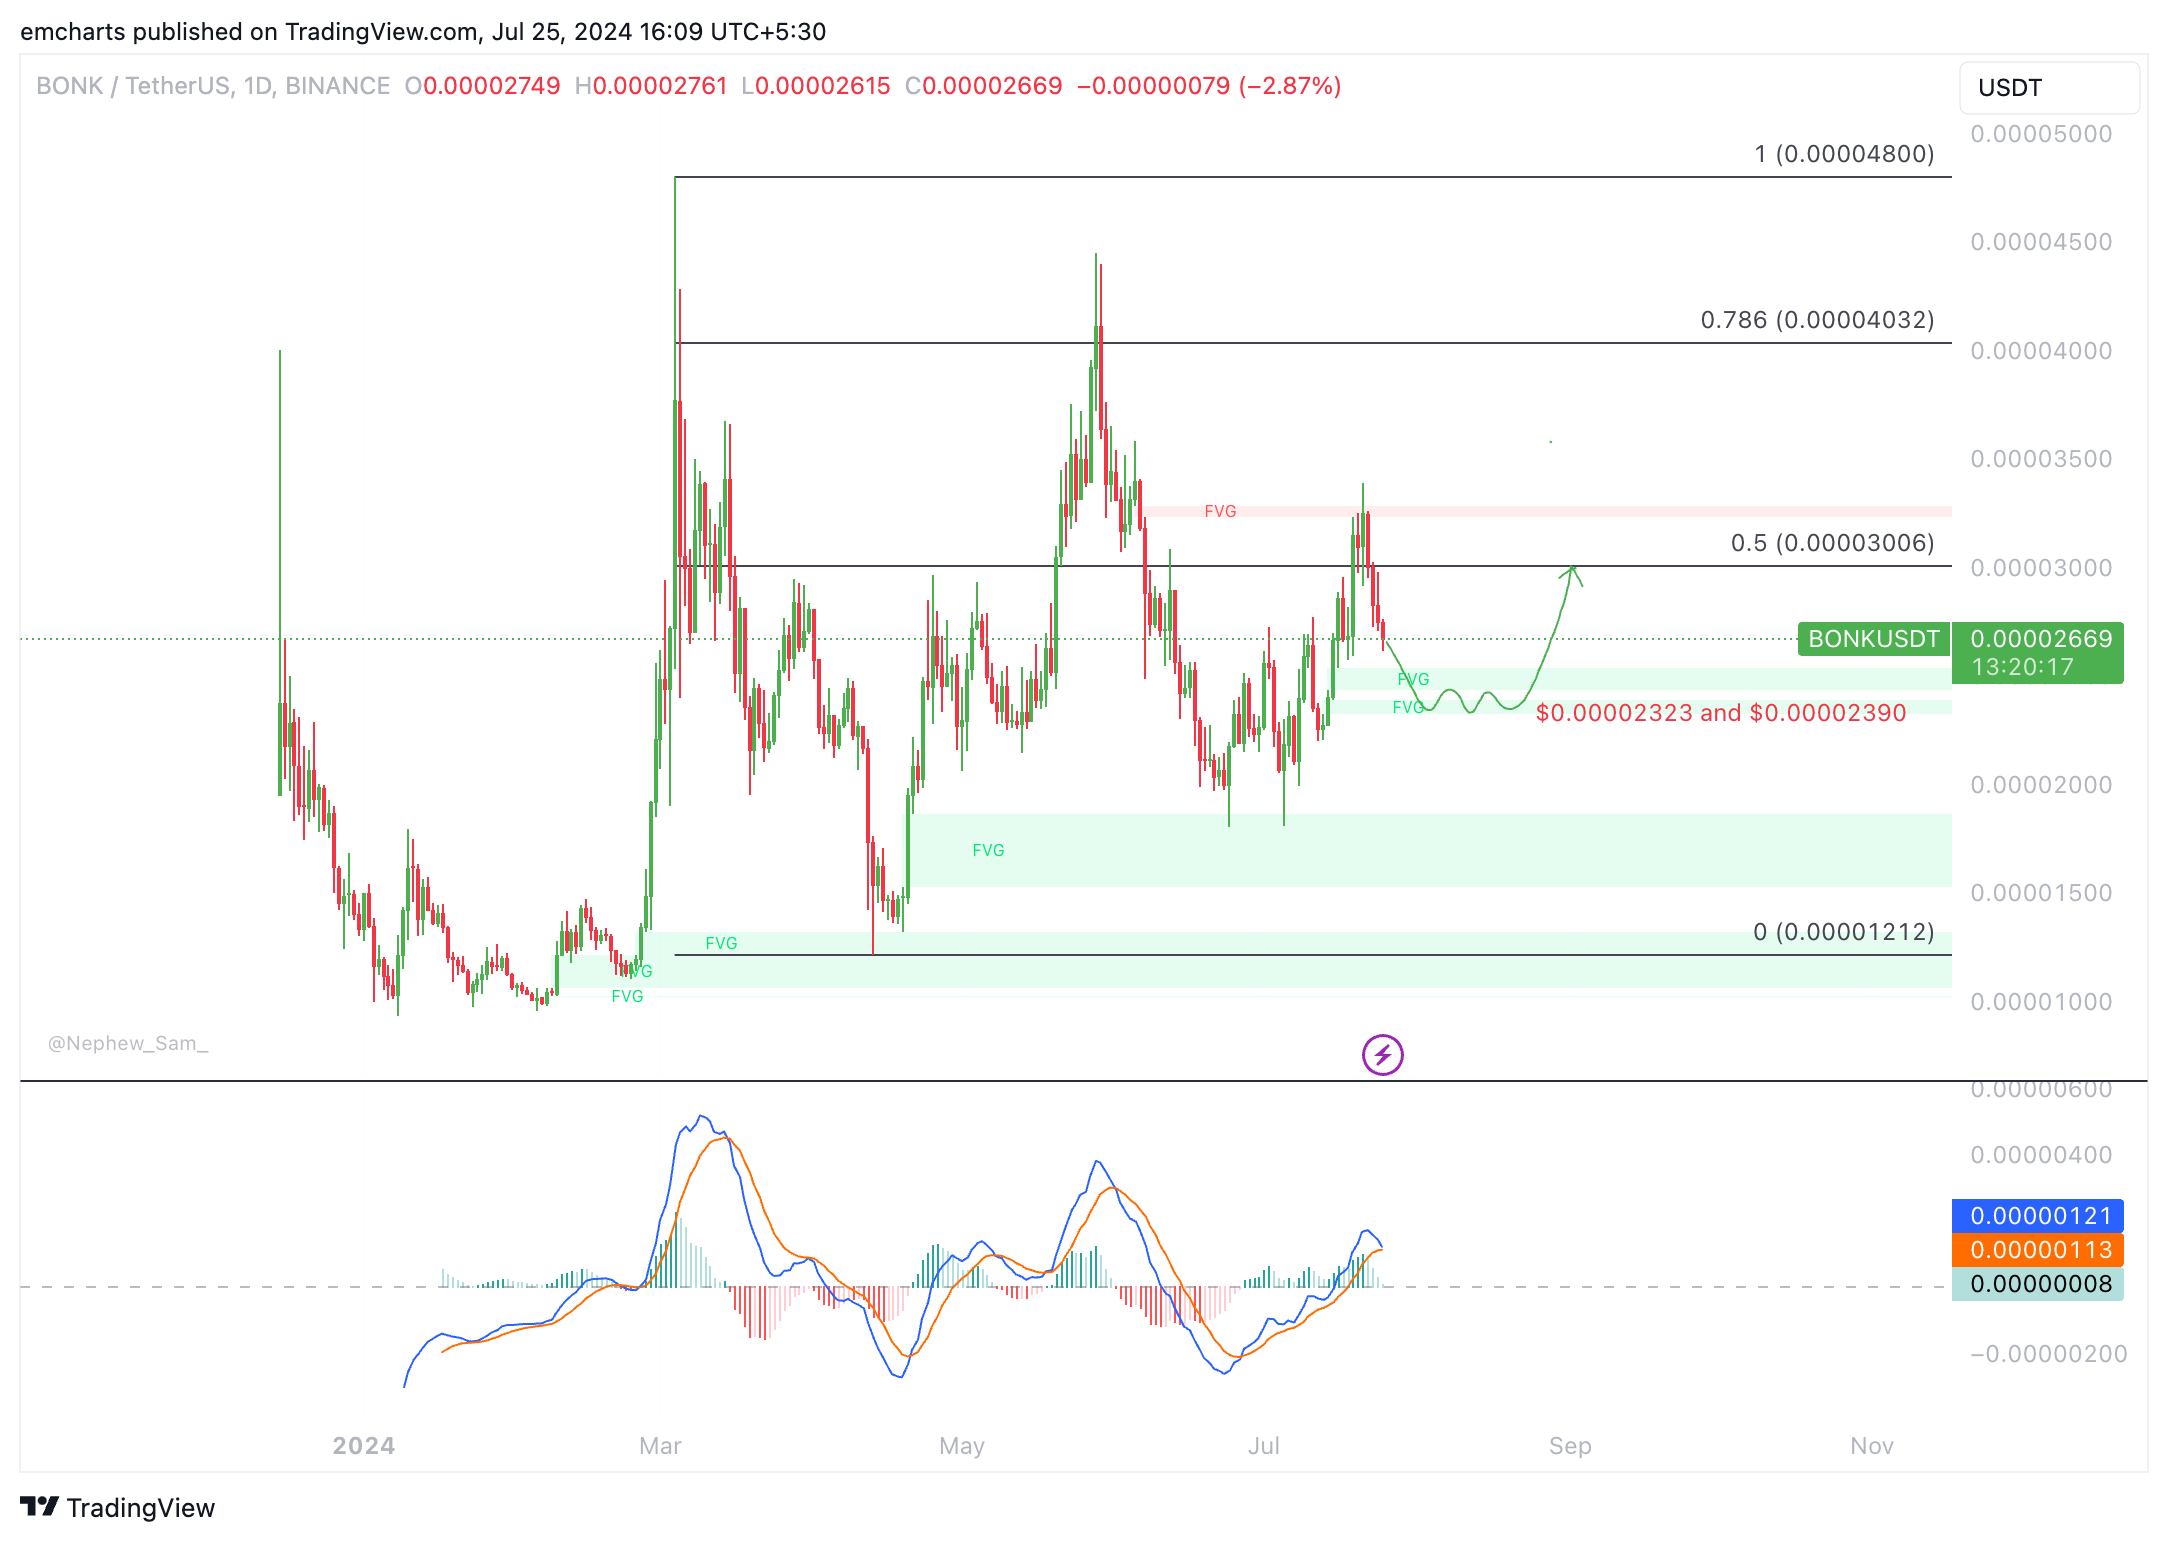
BONK could sweep liquidity between $0.00002323 and $0.00002390, the support zone or the Fair Value Gap (FVG), as seen in the chart above. BONK could fill the imbalance zone and extend gains in its uptrend that started on June 24. 

Key support levels: $0.00002536, $0.00002390, $0.00002323 

Key resistance levels: $0.00003006, $0.00003233

Disclaimer: For information purposes only. Past performance is not indicative of future results.
placeholder
Gold Price Forecast: XAU/USD declines below $4,050 on USD strength and hawkish Fed comments Gold price (XAU/USD) extends the decline to around $4,030 during the early Asian session on Tuesday. The precious metal edges lower as traders dialed back expectations of a US interest rate cut next month.
Author  FXStreet
Nov 18, Tue
Gold price (XAU/USD) extends the decline to around $4,030 during the early Asian session on Tuesday. The precious metal edges lower as traders dialed back expectations of a US interest rate cut next month.
placeholder
Bitcoin Volatility Spikes: Is Options-Driven Pricing Making a Comeback?Bitcoin's volatility is surging, suggesting a shift back to options-driven price action seen before Bitcoin ETFs were launched.
Author  Mitrade
Nov 24, Mon
Bitcoin's volatility is surging, suggesting a shift back to options-driven price action seen before Bitcoin ETFs were launched.
placeholder
2025 Black Friday is coming! Which stocks may see volatility?Coming on the day right after Thanksgiving in the United States, Back Friday marks the start of the holiday shopping season. Sales data from this shopping frenzy day reflects investor confidence and consumer trends. The National Retail Federation (NRF) predicts that holiday season (Nov and Dec) retail sales in 2025 will likely exceed $1 trillion for the very first time, which represents a year-over-year increase of 3.7 to 4.2 percent. Historic data from the past decade show that the retail sector has generally outperformed the S&P 500 during the weeks before and after Black Friday. The following retailing companies are expected to be big winners:
Author  Insights
Nov 24, Mon
Coming on the day right after Thanksgiving in the United States, Back Friday marks the start of the holiday shopping season. Sales data from this shopping frenzy day reflects investor confidence and consumer trends. The National Retail Federation (NRF) predicts that holiday season (Nov and Dec) retail sales in 2025 will likely exceed $1 trillion for the very first time, which represents a year-over-year increase of 3.7 to 4.2 percent. Historic data from the past decade show that the retail sector has generally outperformed the S&P 500 during the weeks before and after Black Friday. The following retailing companies are expected to be big winners:
placeholder
Bitcoin Bleeds to $86K, But This Key Indicator Screams "The Top Isn't In"Bitcoin’s adjusted Spent Output Profit Ratio (aSOPR) has spent nearly two years coiling below the extremes seen at past bull-market peaks, even as BTC trades around $86,300 and down 9% on the week — a setup that leaves open the possibility that this cycle’s true top may still lie ahead.
Author  Mitrade
Nov 25, Tue
Bitcoin’s adjusted Spent Output Profit Ratio (aSOPR) has spent nearly two years coiling below the extremes seen at past bull-market peaks, even as BTC trades around $86,300 and down 9% on the week — a setup that leaves open the possibility that this cycle’s true top may still lie ahead.
placeholder
Bitcoin Price Rebound Gains Traction with $90K Break in SightBitcoin is trading above $87,000 and its 100-hour SMA after rebounding from $83,500, with a bearish trend line at $88,200 and resistance at $89,000–$90,000 now in focus as BTC either breaks higher toward $91,750–$94,000 or slips back toward $86,700, $85,000 and lower supports.
Author  Mitrade
Yesterday 02: 58
Bitcoin is trading above $87,000 and its 100-hour SMA after rebounding from $83,500, with a bearish trend line at $88,200 and resistance at $89,000–$90,000 now in focus as BTC either breaks higher toward $91,750–$94,000 or slips back toward $86,700, $85,000 and lower supports.
goTop
quote