

Coinbase Analysts Warn: Bitcoin’s Upward Trend Could Hit a Wall — Here’s Why

Source Newsbtc

As Bitcoin is experiencing an uptrend in price increasing by 12.6% in the past week to trade above $66,000, analysts at Coinbase in a Friday report have disclosed potential limitations to its upward trajectory due to “increasing sell orders” on the exchange.

According to the report, the recent appreciation in Bitcoin’s value has tempted many traders to capitalize by selling, which could curb further gains.

A Wall Ahead, What Happens To Bitcoin Then?

This report, which analyzes the market’s overall picture, was compiled by Coinbase researchers David Duong and David Han. They noted that sell orders have been rising on Coinbase within 5% to 10% of the mid-price, indicating a strong desire not to see higher prices for the digital currency.

This suggests there might be a cooling-off from recent highs as traders take profits and reposition in response to current market conditions.

According to Duong and Han:

We may be seeing some profit taking at current levels and/or a greater willingness by market participants to sell into price appreciation, which may limit price moves to the upside

Such activities are essential market sentiment indicators that could influence Bitcoin’s short-term value. In their analysis, Duong and Han also reference data from Arkham Intelligence, which highlights some external factors that are also at play contributing to the sell-side pressure.

One significant factor is the ongoing Mt. Gox repayments, which have seen nearly 50,000 Bitcoin moved to exchanges since July 5. Despite this, the Mt. Gox trustee still holds a considerable amount of BTC, adding a layer of uncertainty and potential sell-side pressure to the market.

However, some positive factors might help to offset the increased selling demand. One of the most relevant factors is the US political situation.

In July, the U.S. political dynamics shifted dramatically resulting in a significant depreciation of the US dollar; the DXY index (which measures the dollar against a basket of other major currencies) falling by more than 2%, according to the report.

Since the value of Bitcoin is primarily valued in US dollars, a weaker dollar means a higher relative value of Bitcoin which may provide a buffer against some of the downward pressures from increased sell orders.

Further Roadblock On The Horizon

Besides the Coinbase report that has already signaled an impending correction for Bitcoin, legendary crypto trader, Perter Brandt has also recently shared a notable concern for the top crypto.

Brandt discloses that while he is “impressed” by Bitcoin’s upward trajectory so far, “the sequence of lower highs and lower lows continues despite the halving, despite the [exchange-traded fund] ETf, despite the hype.”
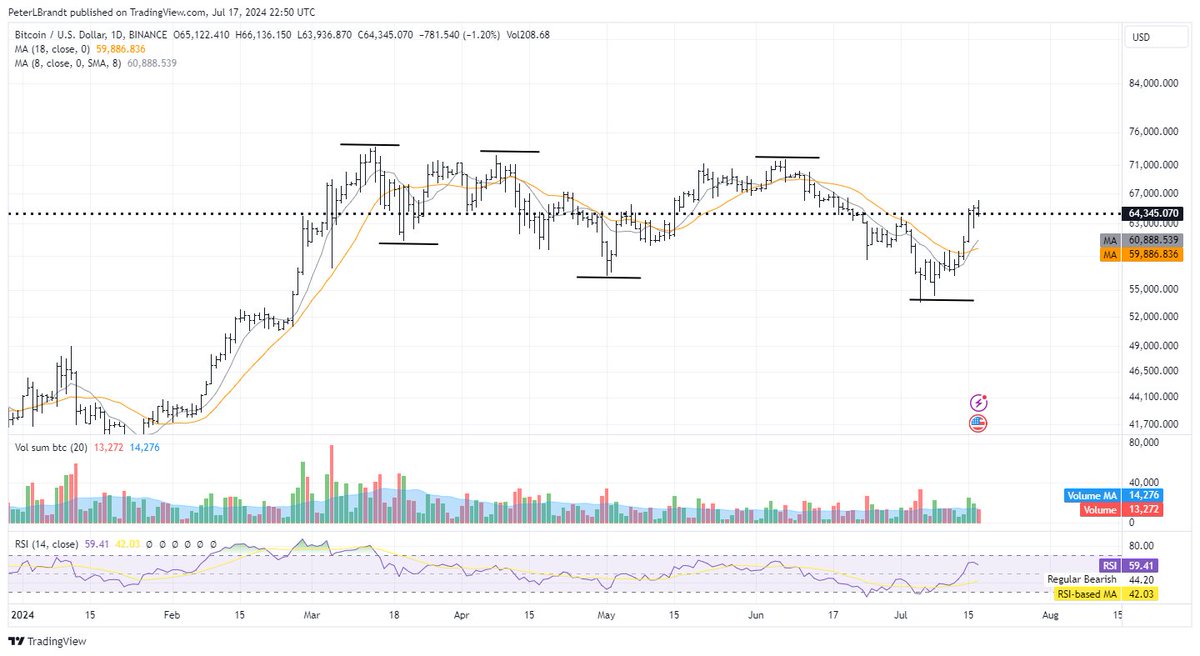
Bitcoin chart shared by Peter Brandt on X

This statement suggests a troubling trend for Bitcoin, indicating that instead of the asset having broken out of its current range, it has only continued to move in lower highs and lows.

Bitcoin trades for $66,447, a 3.9% rise from its previous lows of $63,229 in the past 24 hours.

Bitcoin (BTC) price chart on TradingView

Featured image created with DALL-E, Chart from TradingView

Disclaimer: For information purposes only. Past performance is not indicative of future results.
placeholder
Fed hike odds near 90% into Wednesday's decision — how to trade the dollar, gold and the S&P 500A 0.3% monthly core CPI print has lifted the market-implied probability of a 25bp Fed hike on 16 September to roughly 86.5% ~ 90%, which would be the first increase since July 2023. Here is the decision timeline, the pricing versus the forecasts, both scenarios, and the key levels for the dollar, gold and the S&P 500.
Author  Suzie
Sep 14, Mon
A 0.3% monthly core CPI print has lifted the market-implied probability of a 25bp Fed hike on 16 September to roughly 86.5% ~ 90%, which would be the first increase since July 2023. Here is the decision timeline, the pricing versus the forecasts, both scenarios, and the key levels for the dollar, gold and the S&P 500.
placeholder
Silver breaks $64 as precious metals rebound — can gold hold the $4,280 line into the Fed decision?Silver has climbed back above $64 an ounce for the first time this week, leading a broad rebound across precious metals hours before the Federal Reserve delivers what is expected to be its first rate hike since 2023. Spot silver was last at $64.64, up 1.49% on the day, while gold reclaimed $4,300 and platinum and palladium both advanced. The question now is whether the bounce is a genuine turn — or a pause before the Fed's dot plot decides the next move.
Author  Suzie
Sep 16, Wed
Silver has climbed back above $64 an ounce for the first time this week, leading a broad rebound across precious metals hours before the Federal Reserve delivers what is expected to be its first rate hike since 2023. Spot silver was last at $64.64, up 1.49% on the day, while gold reclaimed $4,300 and platinum and palladium both advanced. The question now is whether the bounce is a genuine turn — or a pause before the Fed's dot plot decides the next move.
placeholder
Bitcoin falls below $75,000 as the CLARITY Act fails in the Senate — what the vote means for cryptoThe US Senate blocked the Digital Asset Market CLARITY Act in a 49-50 procedural vote, sending Bitcoin briefly below $75,000 — its biggest one-day drop since June. Ethereum fell more than 8%, Coinbase slid 10% and $75 billion of crypto market value evaporated. Here is what the vote was, why it failed, and the levels that matter now.
Author  Suzie
Sep 16, Wed
The US Senate blocked the Digital Asset Market CLARITY Act in a 49-50 procedural vote, sending Bitcoin briefly below $75,000 — its biggest one-day drop since June. Ethereum fell more than 8%, Coinbase slid 10% and $75 billion of crypto market value evaporated. Here is what the vote was, why it failed, and the levels that matter now.
placeholder
Dow drops 631 points as the Fed hikes — but futures are rebounding: what's next for US stocks?The Dow fell 631 points and the S&P 500 closed below 7,600 after the Fed hiked rates for the first time since 2023, with the dot plot showing 16 of 18 officials expect more tightening. Asia-session futures are already recovering — here are the levels and analyst views that decide whether 7,500 holds.
Author  Irene Q.
Yesterday 02: 54
The Dow fell 631 points and the S&P 500 closed below 7,600 after the Fed hiked rates for the first time since 2023, with the dot plot showing 16 of 18 officials expect more tightening. Asia-session futures are already recovering — here are the levels and analyst views that decide whether 7,500 holds.
placeholder
Dollar index tops 100 for the first time since July as the Fed's hawkish dot plot sinks inThe U.S. dollar index broke back above 100 for the first time since 31 July after the Fed delivered its first rate hike since 2023, with the dot plot showing 16 of 18 officials expect at least one more increase this year. Here are the levels that matter for DXY, the currencies feeling it most, and what to watch next.
Author  Irene Q.
Yesterday 02: 45
The U.S. dollar index broke back above 100 for the first time since 31 July after the Fed delivered its first rate hike since 2023, with the dot plot showing 16 of 18 officials expect at least one more increase this year. Here are the levels that matter for DXY, the currencies feeling it most, and what to watch next.
goTop
quote