

Chainlink poised for a rally as whales buy the dips
- Chainlink’s price bounced from the weekly support level at $13.15 and extends recovery on Tuesday.
- On-chain data shows that whales have accumulated 2.08 million LINK in the past seven days.
- A daily candlestick close below $12.59 would invalidate the bullish thesis.
Chainlink’s (LINK) price bounced from the $13.15 support level last week and extends recovery above $14.50 on Tuesday. According to Lookonchain data, over the past week, 54 new whale wallets withdrew 2.08 million Oracle tokens valued at $30.28 million from Binance, suggesting less selling pressure on Chainlink’s price and expecting more gains in LINK are likely.
Chainlink breaks above the descending trendline, sets stage for an upward rally
Chainlink broke above the descending trendline in the daily chart (as shown in chart below) on Monday and trades 2.5% higher on Tuesday, reaching $14.71. This descending trendline is drawn from joining multiple swing highs from late May to late June. Additionally, LINK found support on its weekly level at $13.15.
If this trendline holds as pullback support, LINK price could rally 14% to retest its 61.8% Fibonacci retracement level at $16.76, drawn from a swing high in late May to a swing low in late June.
The Relative Strength Index (RSI) and the Awesome Oscillator (AO) indicators on the daily chart are below their neutral value of 50 and zero. If bulls are indeed making a comeback, then both momentum indicators must regain their positions above their respective neutrality levels. This development would provide additional momentum to the ongoing recovery rally.
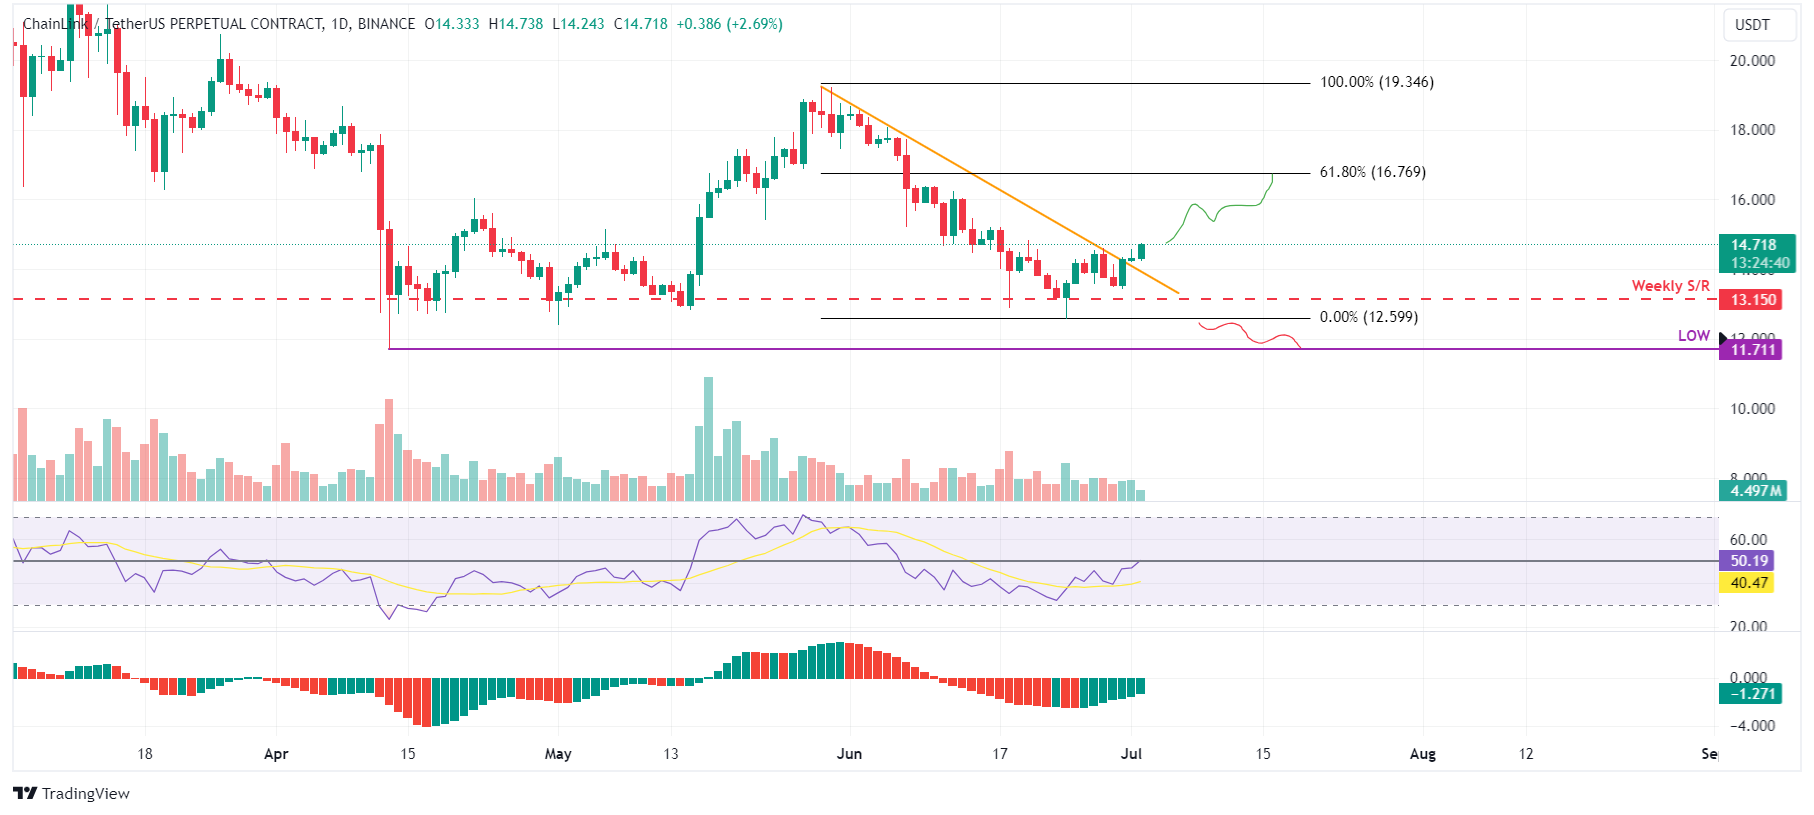
LINK/USDT daily chart
However, if LINK's daily candlestick closes below $12.59 and establishes a lower low on the daily timeframe, it may signal a shift in market dynamics that favors bearish sentiment. Such a change could invalidate the bullish outlook, leading to a 7.5% decline in Chainlink’s price to retest the April 13 low at $11.71.
Recommended Articles


