

Ethereum ecosystem active users spike 55% in Q1, 2x ETH ETF records impressive volume
- Volatility Shares 2x ETH ETF records over $15 million on second day of trading.
- Average daily Ethereum ecosystem users spike by more than 55% in Q1'24.
- Ethereum needs to overcome key resistance before any attempt to flip the yearly high of $4,093.
Ethereum (ETH) failed to overcome a key resistance as it resumed its horizontal trend on Thursday. Following the lag, the Volatility Shares 2x ETH Futures ETF showed considerable growth on its second day of trading.
Daily digest market movers: ETHU, daily active users, and fee growth
Volatility Shares 2x Ether Futures ETF (ETHU) volume tripled on its second day of trading, reaching $15 million. It did over $5 million on its first day of trading — more than all ETH futures ETFs did on their first day. Bloomberg analyst Eric Balchunas termed the performance "impressive," considering ETF volume usually slows down after their "Big Day One."
Also read: Ethereum open interest surges by 50%, SEC Chair says ETH ETF launch will take more time
ETHU's success was likely triggered by the expectation of spot ETH ETFs after the SEC approved issuers' 19b-4 filings on May 23.
Users have been marching into the Ethereum ecosystem despite its Q1 price lag compared to Bitcoin. According to Bitwise, the average daily Ethereum ecosystem user growth reached 2.25 million in Q1 2024, a more than 55% increase from the previous quarter. Much of this growth seems to have come from the Base ecosystem, which has racked up over 7 million users since January, according to the Dune analytics dashboard from @watermeloncrypto.
Meanwhile, Ethereum Layer 1 has still outperformed L2s and Solana combined in terms of fees despite the March Dencun upgrade lowering gas fees. Ethereum Layer 1 total fees is about $5.66 million compared to $1.74 million from L2s and Solana combined.
Read more: Ethereum leveraged ETFs go live as price fails to react
ETH technical analysis: Ethereum's upward move rejected by key resistance
Ethereum is trading around $3,840 on Thursday as long traders continue to lead liquidations. According to Coinglass, ETH liquidations reached $25.95 million in the past 24 hours, with long liquidations leading at $14.63 million and shorts at $11.32 million.
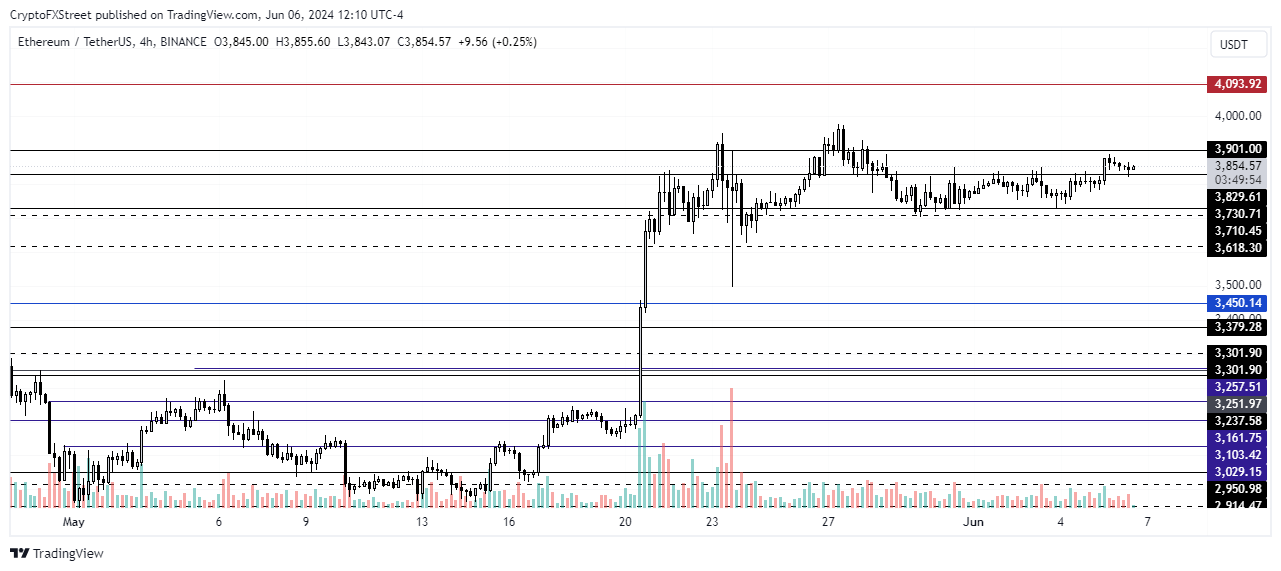
ETH/USDT 4-hour chart
ETH was rejected by the $3,900 level on Wednesday after a slight gain. It would need to break past this level before an attempt to overcome the $4,093 price level.
Also read: Ethereum sustains week-long consolidation, sees over $3 billion exodus from exchanges
The bullish thesis is still in view, provided ETH doesn't trade below $3,618 for an extended period. If ETH breaks below this level, it may hover between $3,301 and $3,600 to fill the liquidity void of March 20 and 21.
Ethereum FAQs
Ethereum is a decentralized open-source blockchain with smart contracts functionality. Serving as the basal network for the Ether (ETH) cryptocurrency, it is the second largest crypto and largest altcoin by market capitalization. The Ethereum network is tailored for scalability, programmability, security, and decentralization, attributes that make it popular among developers.
Ethereum uses decentralized blockchain technology, where developers can build and deploy applications that are independent of the central authority. To make this easier, the network has a programming language in place, which helps users create self-executing smart contracts. A smart contract is basically a code that can be verified and allows inter-user transactions.
Staking is a process where investors grow their portfolios by locking their assets for a specified duration instead of selling them. It is used by most blockchains, especially the ones that employ Proof-of-Stake (PoS) mechanism, with users earning rewards as an incentive for committing their tokens. For most long-term cryptocurrency holders, staking is a strategy to make passive income from your assets, putting them to work in exchange for reward generation.
Ethereum transitioned from a Proof-of-Work (PoW) to a Proof-of-Stake (PoS) mechanism in an event christened “The Merge.” The transformation came as the network wanted to achieve more security, cut down on energy consumption by 99.95%, and execute new scaling solutions with a possible threshold of 100,000 transactions per second. With PoS, there are less entry barriers for miners considering the reduced energy demands.
Recommended Articles


