

Signs are showing ETC correction may be over
- Ethereum Classic crashed 18% after retesting its resistance zone between $33.14 and $34.59.
- Investors could accumulate ETC at support levels extending between $28.53 and $26.67.
- A daily candlestick close below $25.26 would invalidate the bullish thesis.
Ethereum Classic (ETC) crashed 18% between May 23 and June 3, heading towards its major support area of $28.53 and $26.67. A correction to this area could be a buying opportunity for investors before the second leg higher.
Ethereum Classic price eyes for a 17% rally
Ethereum Classic price broke the consolidation zone between $25.26 and $28.63 on May 20 and rallied 20% to the $34.32 level. ETC faced rejection at the $33.32 to $34.59 bearish order block, where market heavyweights have previously placed sell orders in this zone. As a result, ETC has crashed 18% and currently trades at $28.63.
Sidelined buyers could scoop ETC between $28.50 and $27.12, which are the 50% and 61.8% Fibonacci retracement levels drawn from the swing high of $34.32 on May 23 and swing low of $22.67 on April 13, respectively.
If ETC bounces off the $28.50 level and the overall crypto market outlook is bullish, it could rally 17% to retest its previous high of $37.32.
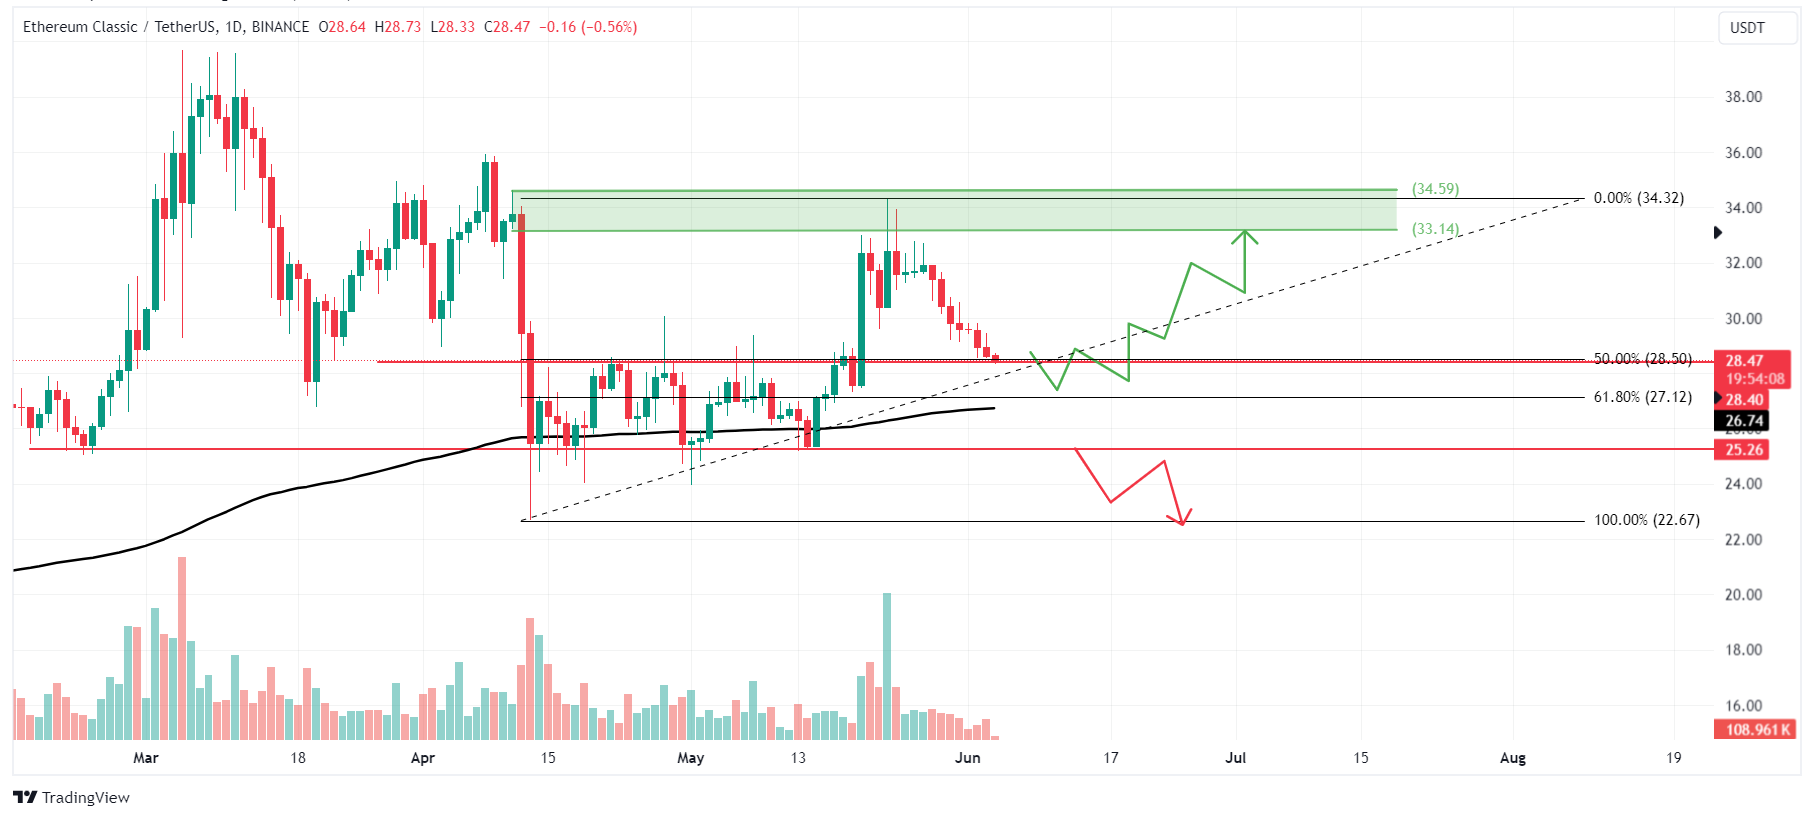
ETC/USDT 1-day chart
However, if the ETC daily candlestick closes below $25.26 and forms a lower low on the daily time frame, itcould lead to a change in market structure favoring the bears. Thus, this change in market structure could invalidate the bullish thesis, leading to an 11% crash in the ETC price to the previous support level of $22.67.
Recommended Articles


