

Arkham price consolidation could yield fruitful double-digit returns
- Arkham price shows a tight consolidation below a key resistance level of $2.58.
- Investors can expect a buying opportunity before ARKM attempts a 47% to $3.22.
- A breakdown of the $2.19 support level will invalidate the bullish thesis.
Arkham (ARKM) price has shown signs of consolidation that could easily propel higher. Due to the current volatility, it is unlikely to break out without providing an accumulation opportunity.
Also read: Artificial intelligence tokens gain 10% despite Bitcoin’s struggle to break past $64,000
Arkham price eyes a clean support level
Arkham price crashed 70% between March 10 and April 13, setting up the $1.16 to $4.00 range. Since then, ARKM has been hovering around $2.85, the midpoint of the said range. The lower highs produced since March 27 can be joined via a trend line to reveal a declining resistance level that coindies with the range’s midpoint at $2.85, which it has been trying to overcome for three months.
If Bitcoin (BTC) continues to slide lower, then Arkham price could get rejected from this resistance confluence, leading to a near-15% pullback into the $2.19 to $2.33 demand zone, coinciding with the $2.19 daily support level. This area is a good place to buy the dip in preparation for what could come next.
Depending on Bitcoin’s outlook, there is a high chance Arkham price bounces off this level in an attempt to overcome the $2.59 hurdle. A successful move could propel ARKM to revisit $3.22, roughly 47% away from $2.19. While this move would be an ambitious one to catch, investors could consider tapering off their holdings from $2.80, which would reduce their risk.
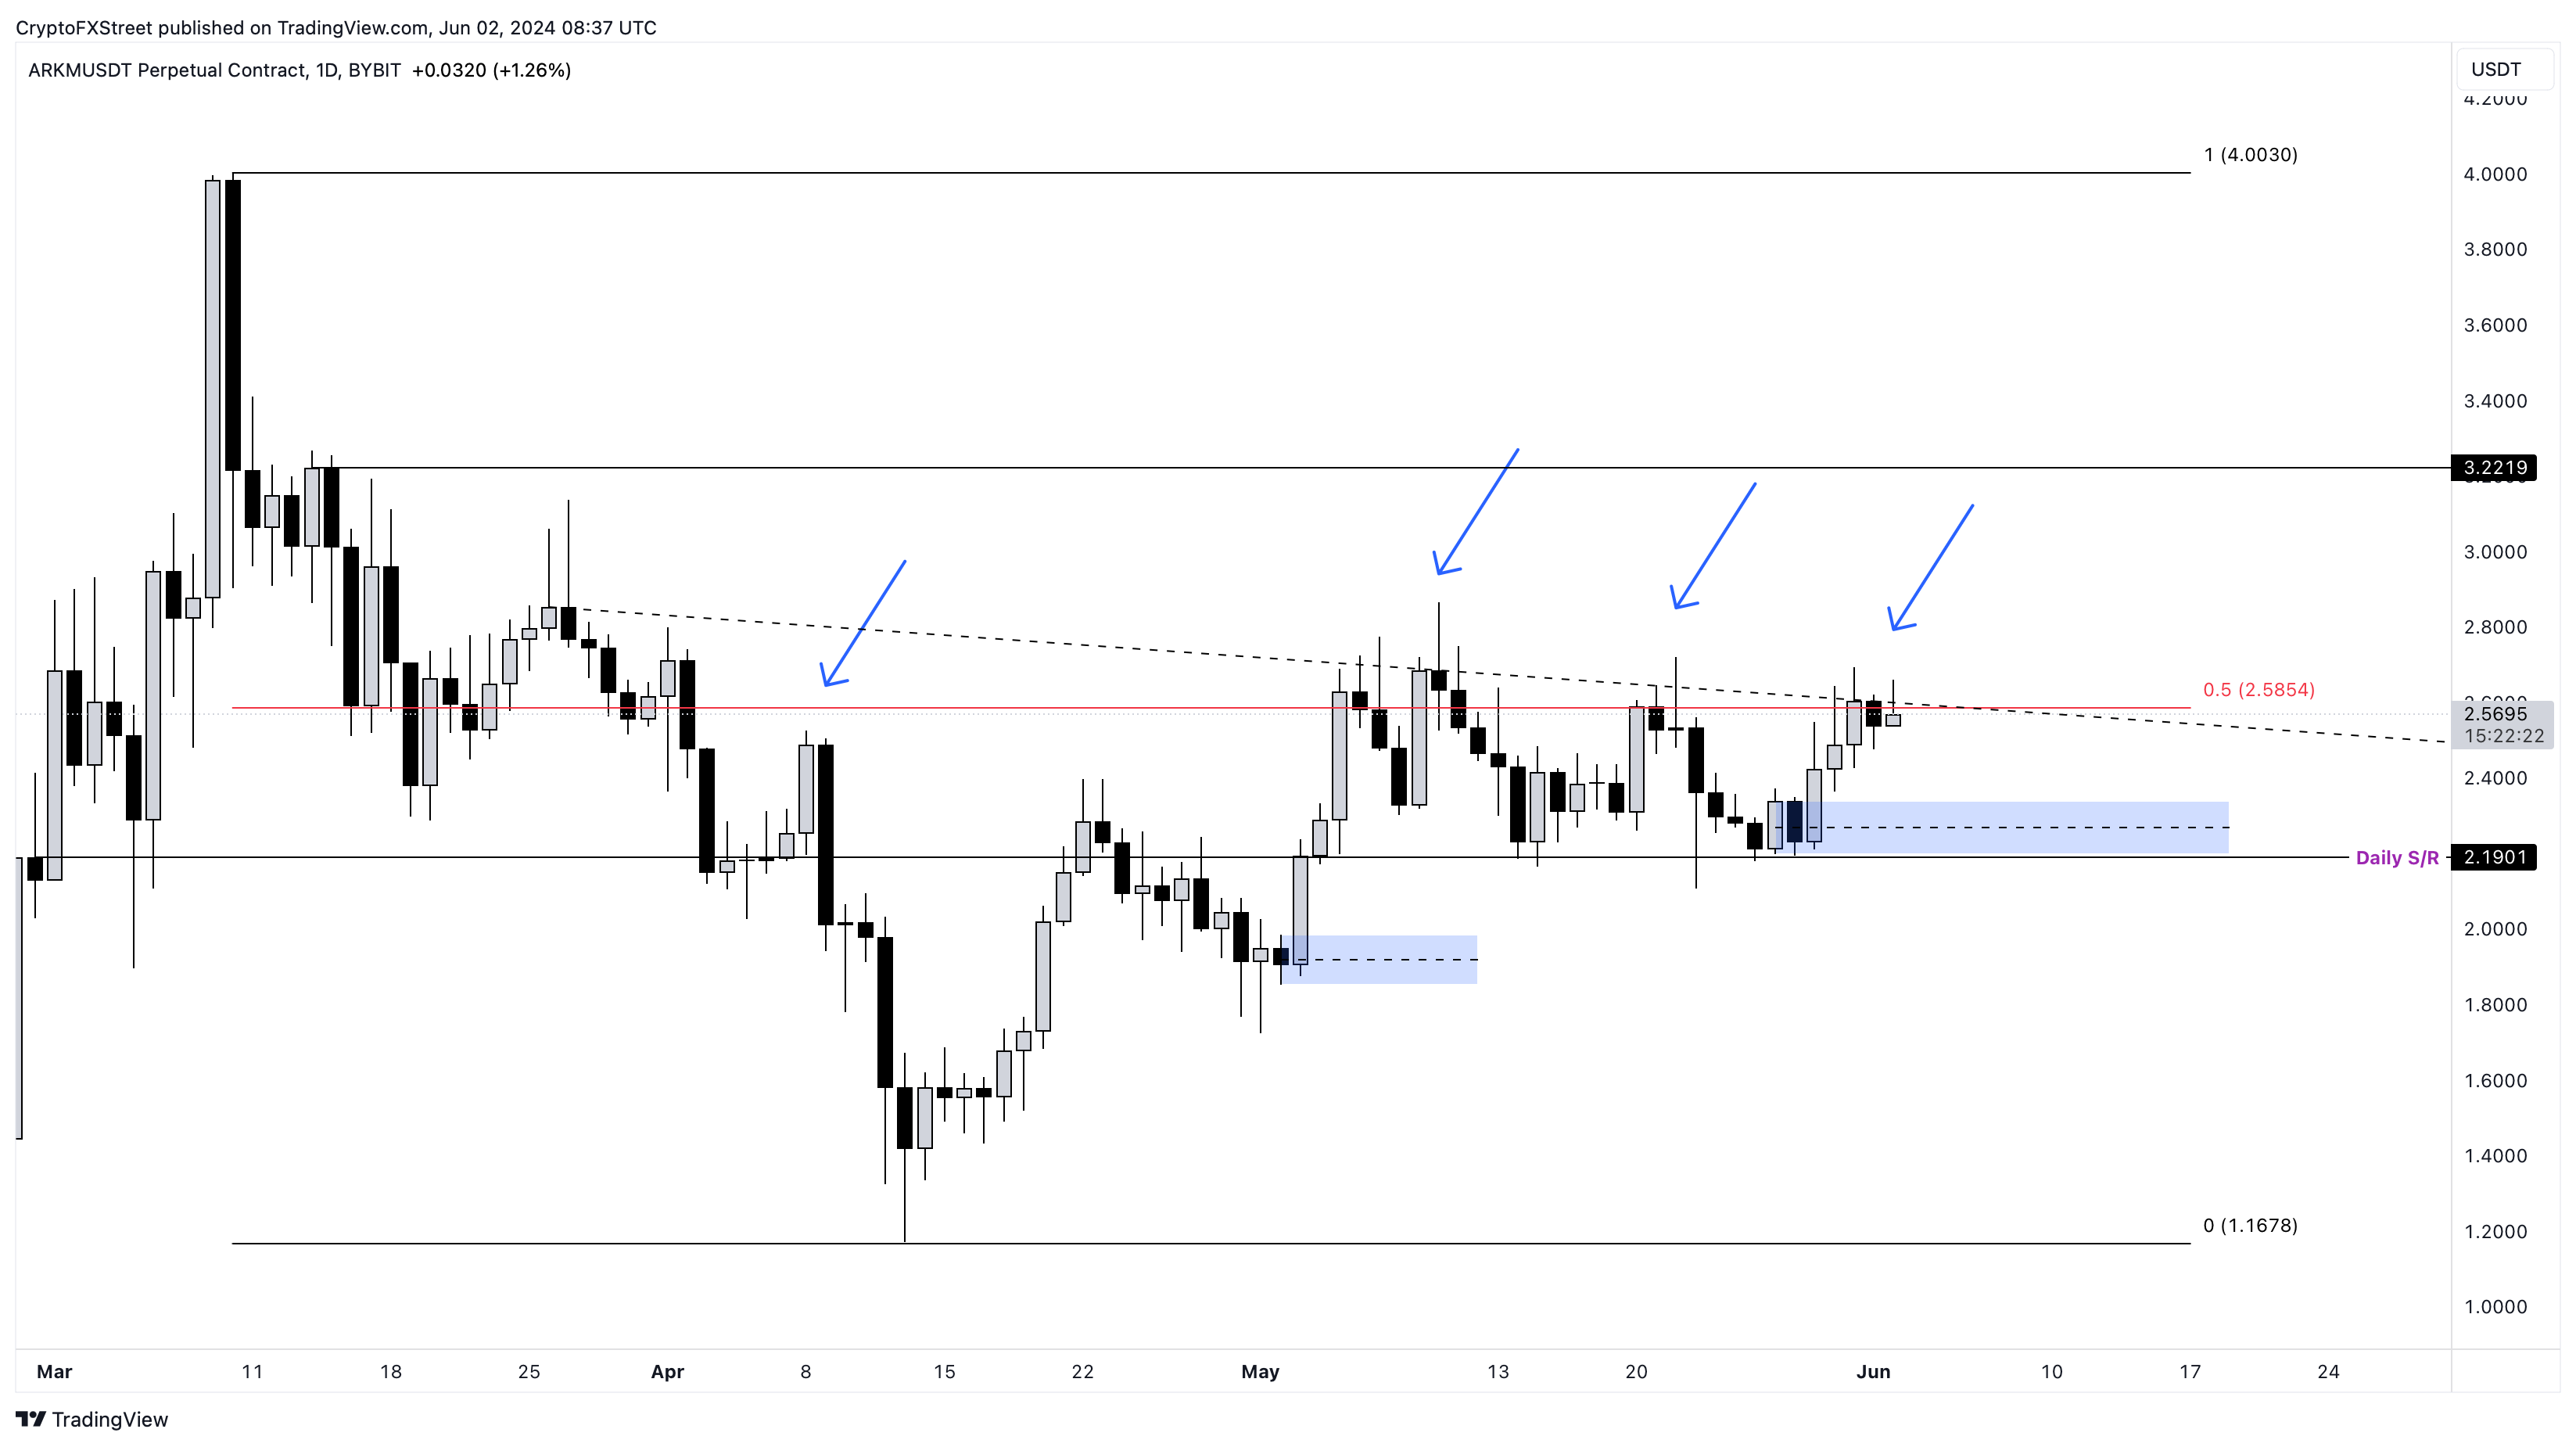
ARKM/USDT 1-day chart
Regardless of the optimistic targets, if Arkham price fails to hold above $2.19, it would signal a lack of interest from sidelined buyers. A flip of this support into a resistance level would invalidate the bullish thesis by producing a lower low, signaling a bearish market structure.
Such development could see Arkham price crash nearly 10% to revisit the $1.85 to $1.98 demand zone.
Also read: OCEAN, GRT, FET: Artificial Intelligence projects with high developer activity
Recommended Articles


