

Why are meme coins crashing?

Source Fxstreet
  • Meme coins like Shiba Inu, Dogwifhat and Floki are all down nearly double digits.
  • The social volume of these dog-themed crypto coins has plummeted even more in the past 24 hours.
  • Bitcoin’s lack of influence seems to play an important role in this slow decay of the crypto market.

The crypto market volatility has undeniably dropped in the past week and can be attributed to the sideways movement of Bitcoin (BTC) price. But despite this downturn, meme coins never failed to surprise investors. Of late, however, meme coins have taken a hit. In the past 24 hours, all dog-themed meme coins like Shiba Inu (SHIB), Dogwifhat (WIF), Floki (FLOKI) and others have shed nearly double-digits in market value.

Also read: Three reasons why meme coin enthusiasts need to stay away from Shiba Inu

Are meme coins fading?

Regardless of Bitcoin’s sideways move, a select few altcoins have always been volatile and moving against the bearish trend. Meme coins were one of the rebel sectors that did this. However, as noted above, SHIB is down nearly 8%, and WIF and FLOKI are also down by 10% each. 
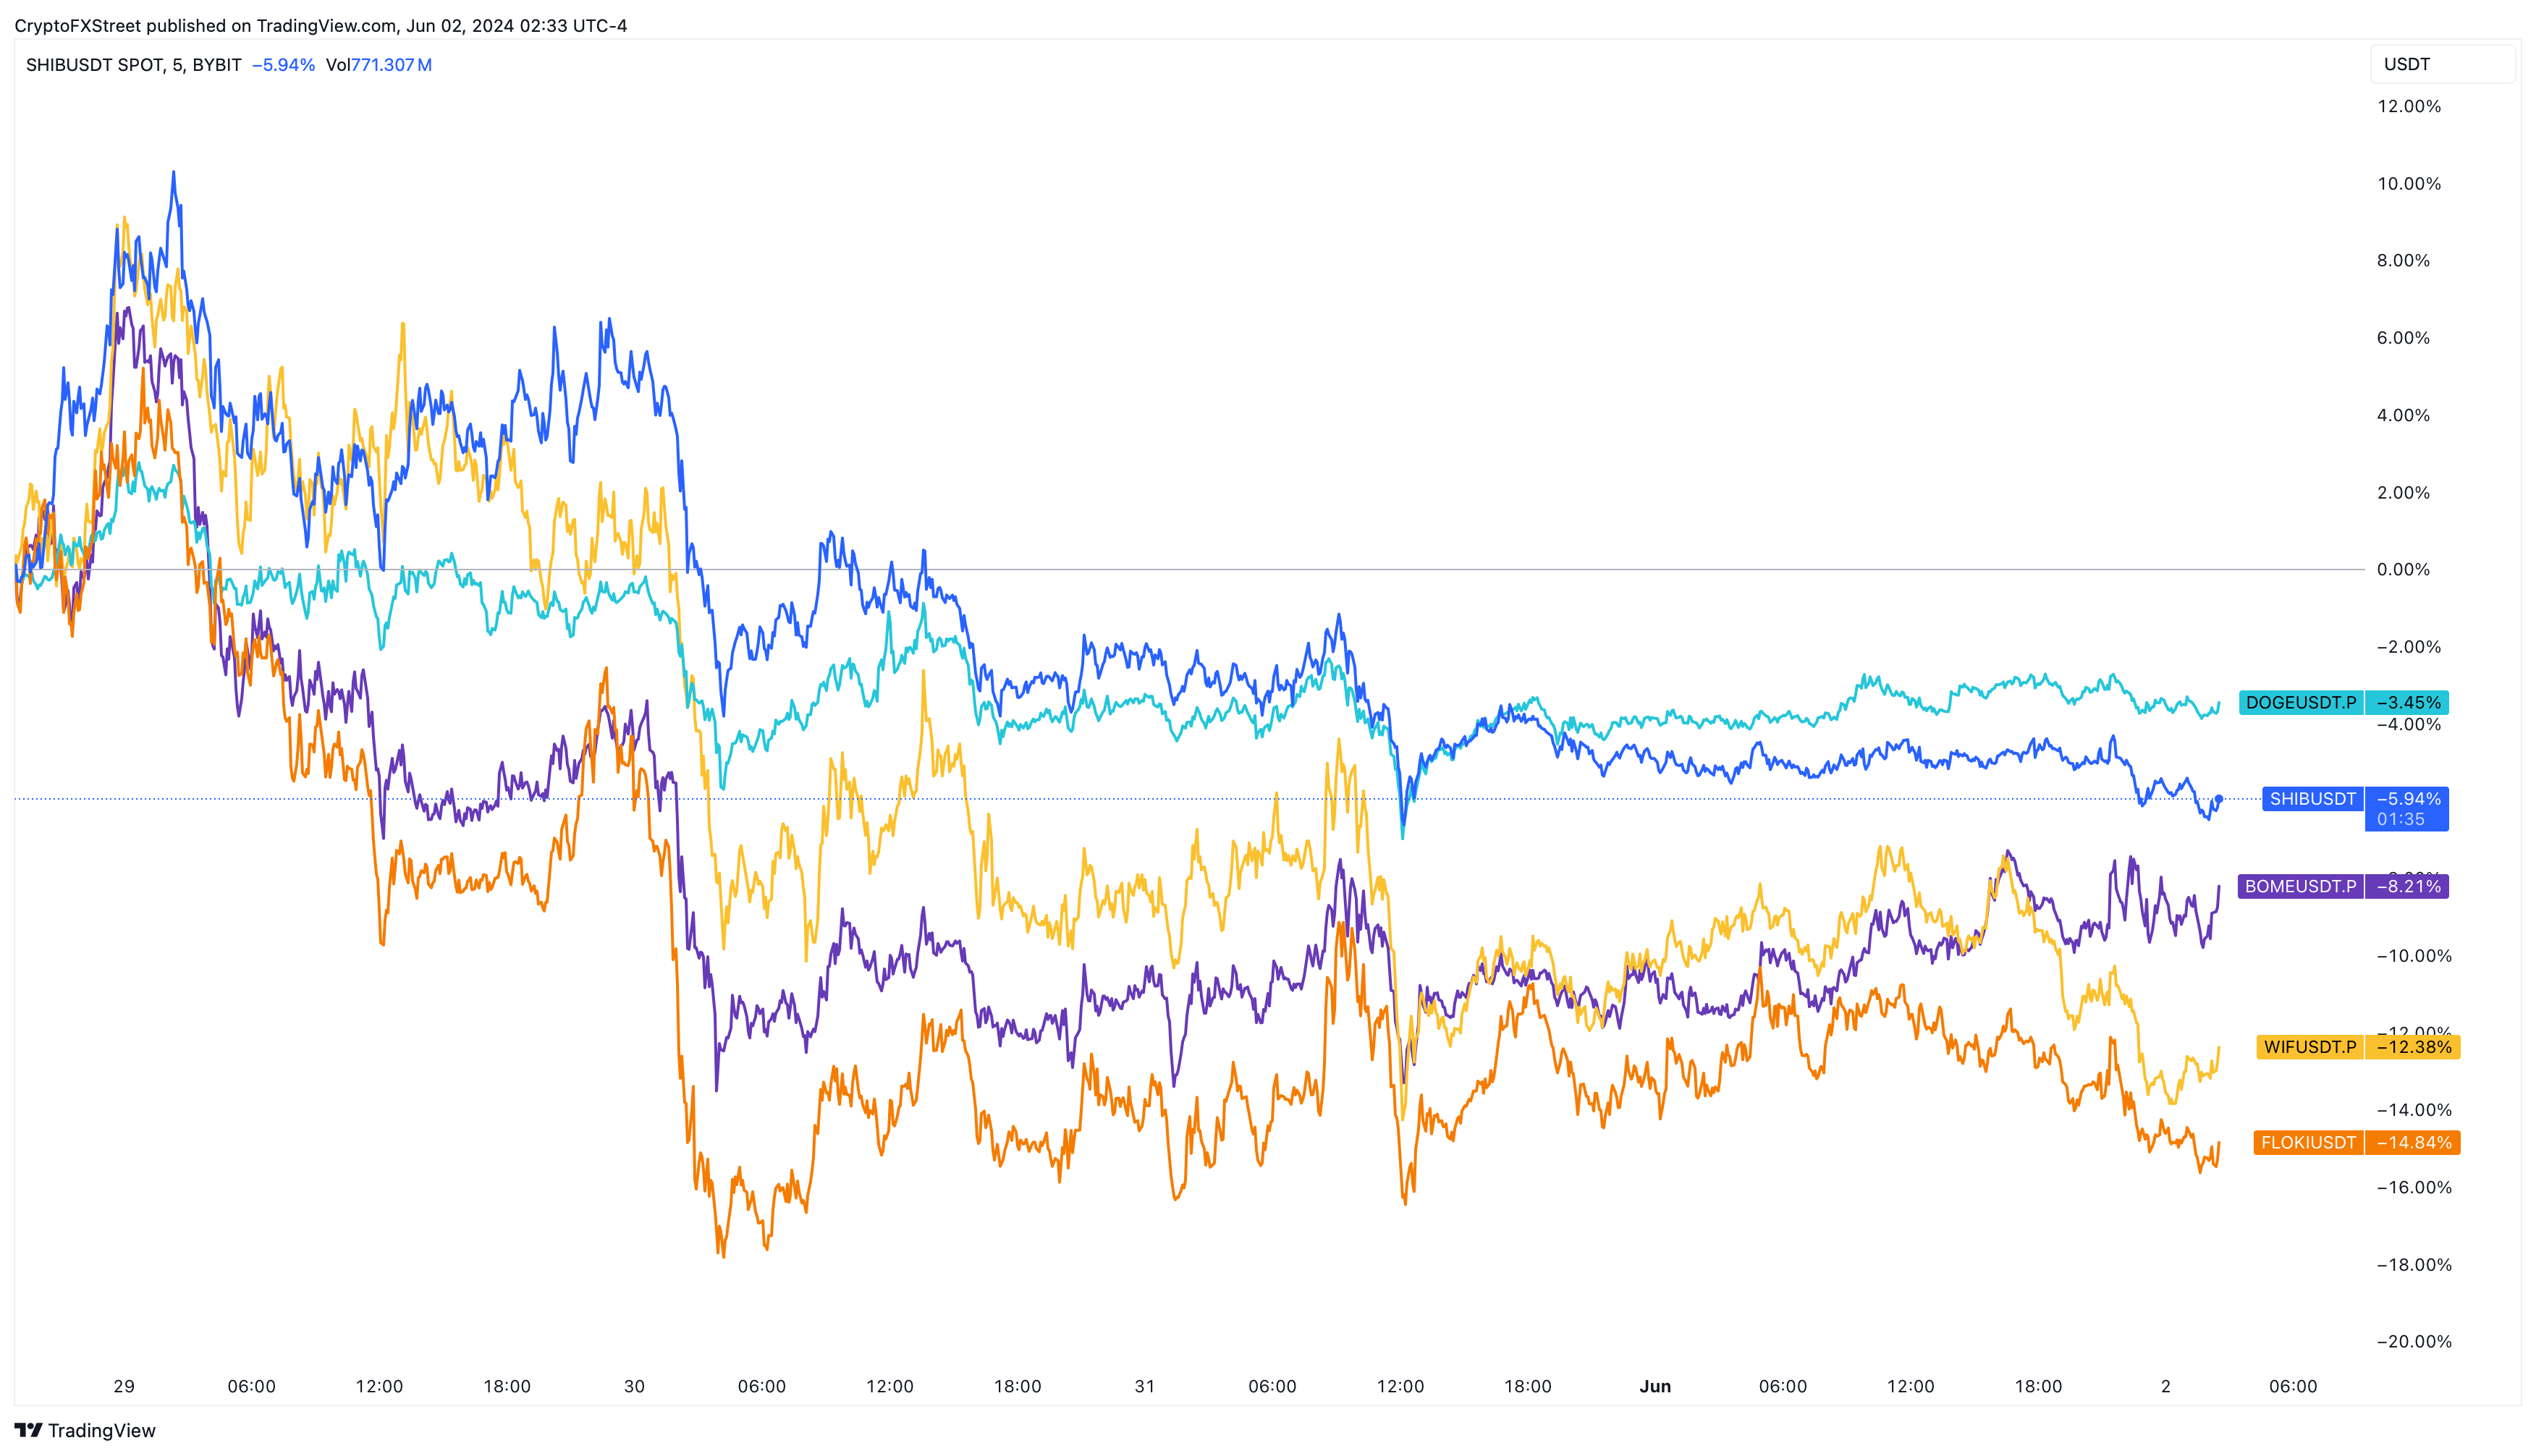
Meme coin performance

Meme coin performance

This effect seems to be applicable to the entire crypto market. The crypto market capitalization is down by $65 billion in less than a week. With the market outlook starting to look bleak, it is likely that investors pull out of risk bets and either rotate their capital into stablecoins or less risky bets. Apart from Bitcoin’s lack of volatility, this could be another reason for meme coins fumbling. 

Read more: As random celebs like Caitlyn Jenner embrace Solana Meme Coins, early hoarders fare best

Total crypto market capitalization

Total crypto market capitalization

As a result, the social volume of these altcoins has also plummeted by more than 20% just int the last 24 hours. Signaling, effectively that the sentiment is also turning negative along with the decline in price.  

Meme coins social volume

Meme coins social volume

What to expect next?

Bitcoin’s bleed is unlikely to stop until it finds a stable support level. As mentioned in previous FXStreet publications, these two key levels are roughly $63,000 and $60,000. These footholds are great buy-the-dip levels for patient buyers who missed the initial entry during the May 1 crash. 

Until Bitcoin reaches a place of strength, this outlook, whether for meme coins or altcoins, will likely continue. Until this happens, crypto traders are likely going to be playing musical chairs, trying to pick an altcoin winner that will most likely pump and dump. The best option is to exercise restraint and preserve capital until the opportunity rears its head. 

Read more: Top trending meme coins BOME, TRUMP, WIF: Bullish signs persist

Disclaimer: For information purposes only. Past performance is not indicative of future results.
placeholder
Bitcoin lost its 200-day average — but the exit started three sessions before the CPIBitcoin fell 2.5% to about $73,400 on 11 November, an 11-week low, breaking its 200-day moving average near $73,100. The 24-hour liquidation tally reached $632 to $705 million, roughly 82% of it longs. But spot ETF outflows began three sessions earlier and USDT's market cap has shrunk $6.6 billion in 60 days — the leveraged length left before the inflation print did. A double top at 81,890 and 81,080 leaves a measured target of 69,366.
Author  Suzie
15 hours ago
Bitcoin fell 2.5% to about $73,400 on 11 November, an 11-week low, breaking its 200-day moving average near $73,100. The 24-hour liquidation tally reached $632 to $705 million, roughly 82% of it longs. But spot ETF outflows began three sessions earlier and USDT's market cap has shrunk $6.6 billion in 60 days — the leveraged length left before the inflation print did. A double top at 81,890 and 81,080 leaves a measured target of 69,366.
placeholder
Core CPI stuck at 0.3% for a third straight month — and BLS couldn't publish the number that would explain itOctober headline CPI rose 0.4% m/m against a 0.3% consensus, and core rose 0.3% for a third consecutive month against 0.2% expected. BLS published no year-on-year figures because October 2025 collection was lost to the government shutdown. Energy cooled to 0.7% from 5.2% — shelter, food and transport services did the rest. The 2-year yield jumped 18 to 21 basis points, the 10-year added 12, and the dollar closed at 102.25.
Author  Irene Q.
15 hours ago
October headline CPI rose 0.4% m/m against a 0.3% consensus, and core rose 0.3% for a third consecutive month against 0.2% expected. BLS published no year-on-year figures because October 2025 collection was lost to the government shutdown. Energy cooled to 0.7% from 5.2% — shelter, food and transport services did the rest. The 2-year yield jumped 18 to 21 basis points, the 10-year added 12, and the dollar closed at 102.25.
placeholder
Gold Tumbles Toward $4,000 as Hotter-Than-Expected CPI Boosts Fed Rate-Hike Bets, Bulls Eye $3,975 SupportAs of the Asian session on Wednesday (November 11), gold prices (XAUUSD) rebounded slightly after a sharp decline in the previous session, last trading near $4,040, up about 0.3% on the d
Author  TradingKey
15 hours ago
As of the Asian session on Wednesday (November 11), gold prices (XAUUSD) rebounded slightly after a sharp decline in the previous session, last trading near $4,040, up about 0.3% on the d
placeholder
Gold Price Analysis Today | Forex Gold Analysis | XAU/USD Analysis - November 11, 2026Get the latest gold price analysis, forex gold insights, and XAU/USD analysis for November 11, 2026. Read on for the details.
Author  Mitrade
15 hours ago
Get the latest gold price analysis, forex gold insights, and XAU/USD analysis for November 11, 2026. Read on for the details.
placeholder
TradingKey Daily Market Briefing: US Stocks Retreat as CPI Tops Estimates; Nvidia Falls Over 5%, AMD and Broadcom Buck the Trend On November 10, the three major U.S. stock indices edged lower. U.S. October inflation data exceeded market expectations, driving Treasury yields rapidly higher and
Author  TradingKey
16 hours ago
On November 10, the three major U.S. stock indices edged lower. U.S. October inflation data exceeded market expectations, driving Treasury yields rapidly higher and
Related Instrument
goTop
quote