


Can BONK Break The Mold? Analyst Predicts Stellar Rise For The Solana Memecoin
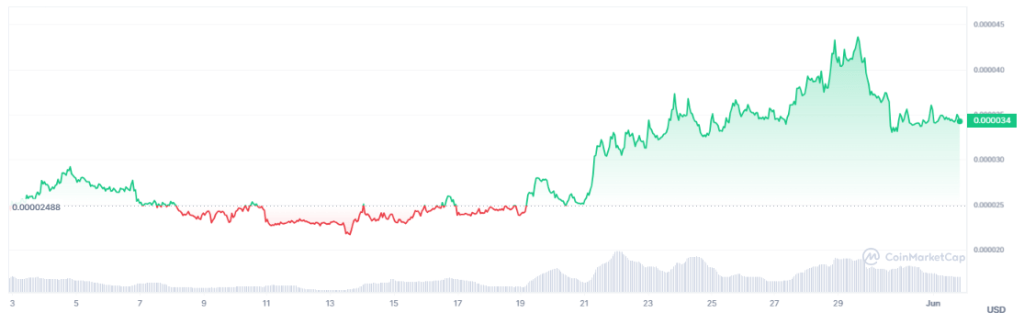
The meme coin market is back in the spotlight, and BONK is no exception. The dog-themed token has seen a price surge of over 40% in the last month, mirroring a broader trend among its rival meme coins.
This recent rally comes amidst positive sentiment surrounding the crypto market, fueled in part by the long-awaited approval of an Ethereum ETF. Analysts are cautiously optimistic about BONK’s future, with some predicting a potential return to its all-time high.
Analyst Bullish On New ATH For BONK
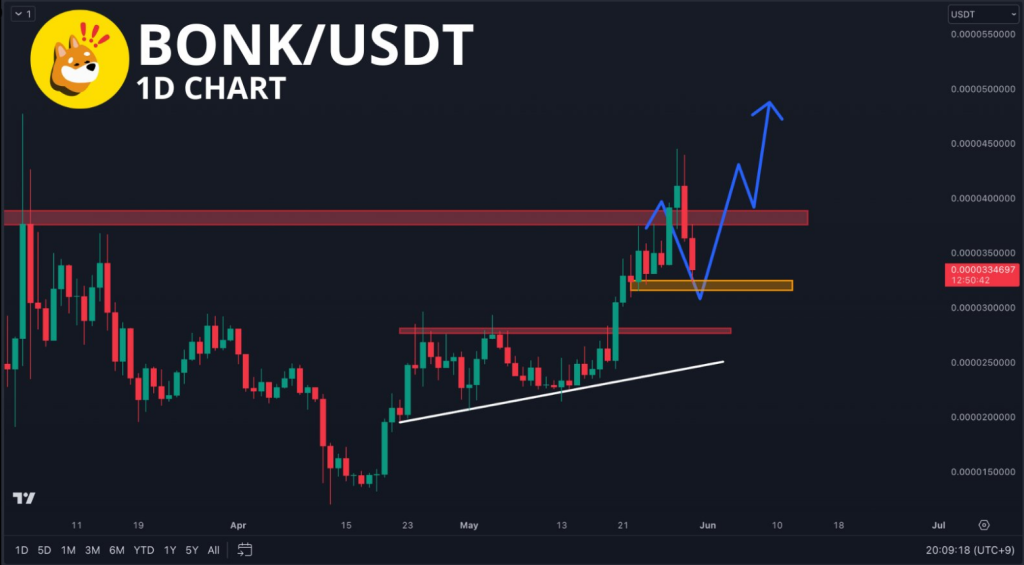
Renowned crypto analyst CryptoJack has been tracking BONK’s price movement closely. In a recent analysis, he highlighted that the coin is following a bullish pattern he outlined earlier.
The price of $BONK is doing exactly what I said it would do in my analysis last week.
It was rejected by the resistance and now needs to bounce from the orange area of support to stay bullish.
If we can stay above this area, I am expecting new ATHs very soon for #BONK! pic.twitter.com/j3Abd7J5YA
— CryptoJack (@cryptojack) May 30, 2024
However, CryptoJack emphasizes the importance of a crucial support level – visualized as an “orange zone” on charts. If BONK can maintain its position above this zone, the analyst predicts a potential breakout and a surge towards new all-time highs (ATHs).
BONK’s all-time high of $0.00004547, reached in March 2024, currently sits about 25% above the current price. While this historical peak suggests room for growth, some experts remain cautious. Technical analysis, the method CryptoJack employs, relies on past price movements to predict future trends, but it’s not a foolproof science.
Meme Coin Frenzy: Booms And Whimpers
The meme coin market has a reputation for being driven more by hype and social media trends than by underlying fundamentals. This can lead to explosive price increases, but also to equally dramatic crashes. Remember “Dogefather” Elon Musk’s offhand tweets sending Dogecoin prices into a frenzy, only to see them plummet just as quickly? BONK is not immune to such influences.
Meanwhile, based on the current price prediction, Bonk is anticipated to rise by an impressive 226%, reaching $0.000112 by July 1, 2024. This substantial increase suggests a highly bullish long-term outlook despite the current bearish sentiment indicated by technical indicators.
The Fear & Greed Index, currently at 72, points towards a high level of greed in the market. This index measures market sentiment and a reading of 72 indicates that investors are exhibiting strong buying behavior, possibly driven by the expectation of future gains.
However, such high levels of greed can often lead to overbought conditions, where the asset’s price may be inflated beyond its intrinsic value, raising the risk of a sharp correction.
Featured image from Pngtree, chart from TradingView
Recommended Articles


