

Top trending meme coins BOME, TRUMP, WIF: Bullish signs persist
- Trump price bounced 57% from its previous support level of $15.95.
- Dogwifhat price is likely to pull back into the major support level between $3.22 and $3.04.
- Book Of Meme price could break out from a parallel channel pattern.
Prices of top trending meme coins Trump (MAGA), Dogwifhat (WIF) and Book Of Meme (BOME) increase on Friday, defying the mild losses seen among the main cryptocurrency assets. The technical outlook for the three coins hints at further gains ahead, particularly for MAGA and BOME, while a short-term correction in WIF is the most likely scenario before it can resume gains.
Trump meme coin shows recovery
Trump (MAGA) meme coin crashed 35% on Thursday as former US President Donald Trump was found guilty on 34 felony counts related to falsifying business records and the case involving adult entertainer Stormy Daniels.
However, MAGA quickly bounced 57% to trade at $14.91 at the time of writing, from its previous support at $9.78.
If the overall crypto market sentiment and news about Donald Trump is positive, then MAGA could rally 30% to $19.92, the 127.2% Fibonacci extension level from swing high at $16.60 to swing low at $7.04.
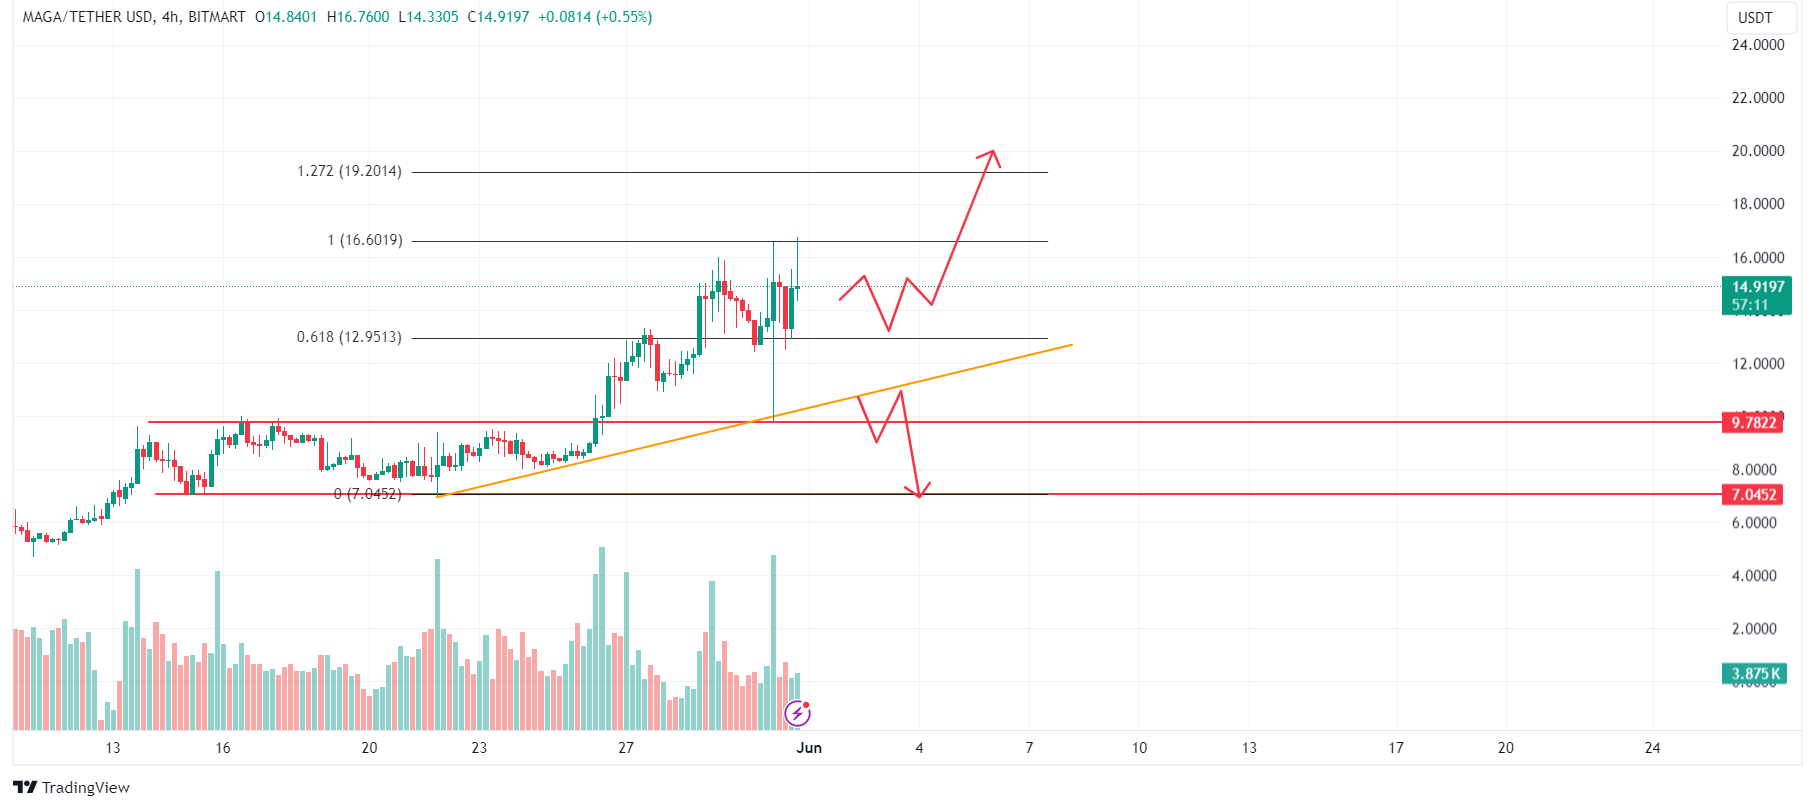
MAGA/USDT 4-hour chart
On the other hand, if Trump's price closes below $9.90, it would invalidate the bullish thesis by producing a lower low in the daily time frame, leading MAGA to crash an extra 30% and hitting the previous support level of $7.04.
Dogwifhat price eyes 13% gains
Dogwifhat's price, a Solana-based meme coin, crashed 20% from its Wednesday high of $4.08 due to recent fraud events involving IGGY and other celebrity-based meme currencies. Due to recent fraudulent incidents like IGGY, Solana-based meme coins are plummeting, with WIF 20% from its high at the $4.08 mark. Still, WIF pared some of the recent losses on Friday, increasing by around 3% on the day to $3.46 at the time of writing.
WIF could find support between the $3.22 and $3.04 levels, which also coincide with the 61.8% Fibonacci retracement line. From there, it could rally 13% to $3.66 level which is the previous bearish order block on May 30.
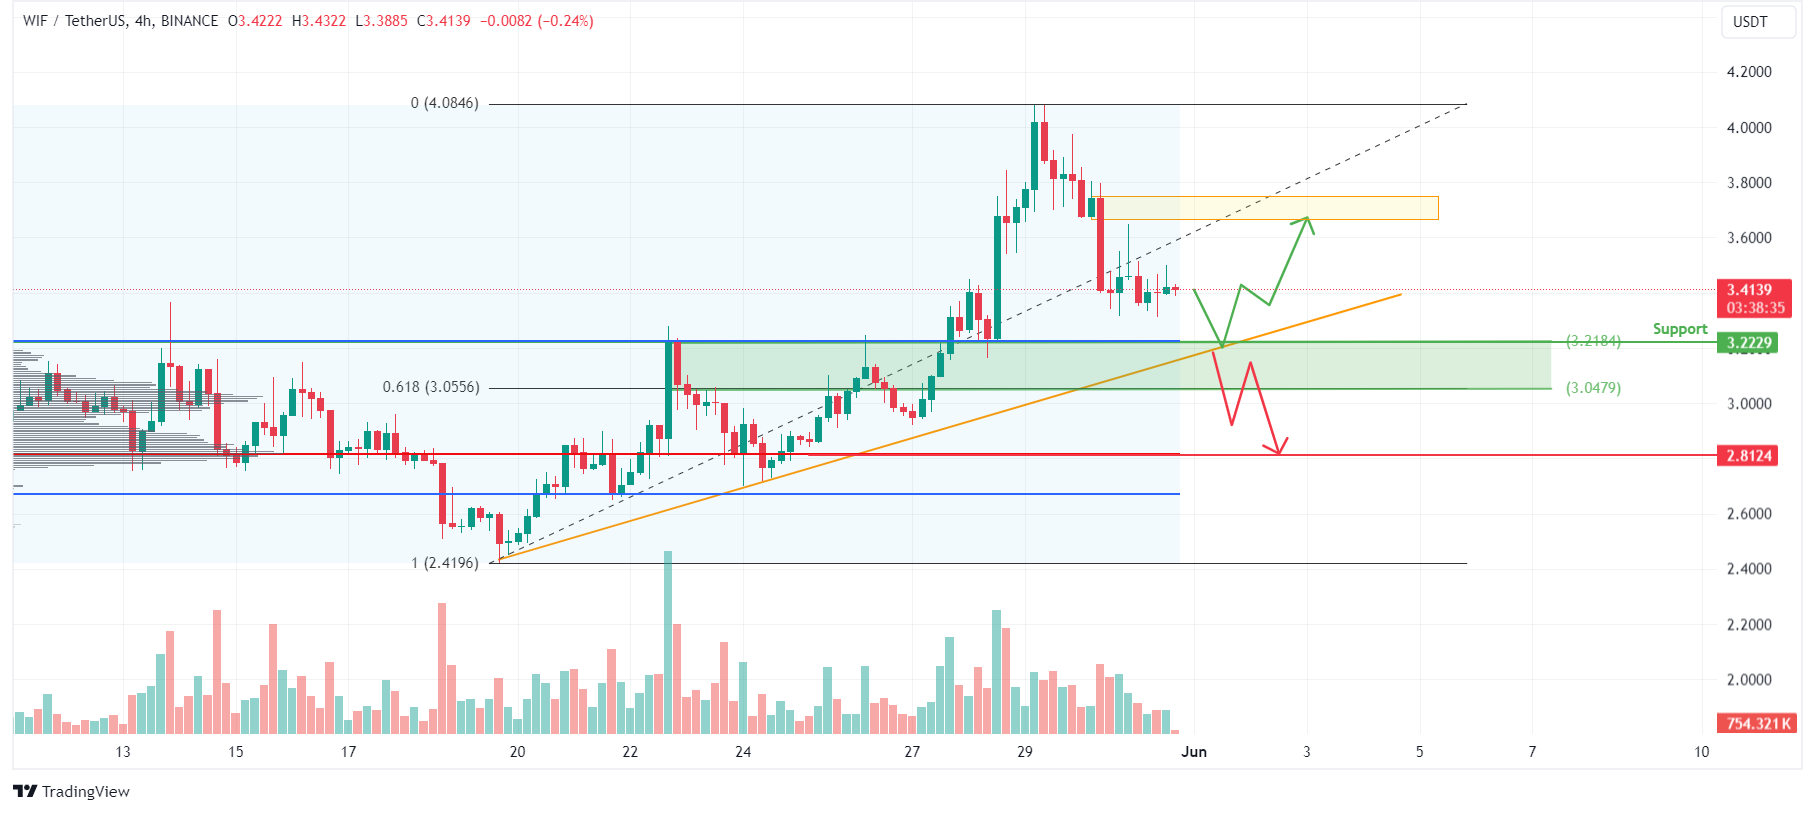
WIF/USDT 4-hour chart
On the other hand, if Dogwifhat's daily candlestick price closes below the $3 level, it would produce a lower low and signal a break in the market structure. This move would invalidate the aforementioned bullish thesis, potentially triggering an extra 7% crash to the high volume node of the volume profile at $2.81.
Book of meme price wants to move higher
BOME price is currently getting rejected by the resistance at the upper channel at $0.0159.
If BOME breaks out of the channel, then it could rally 22% to the $0.0207 level, which is the daily close of March 17 and also the technical target (distance between the parallel channel.)
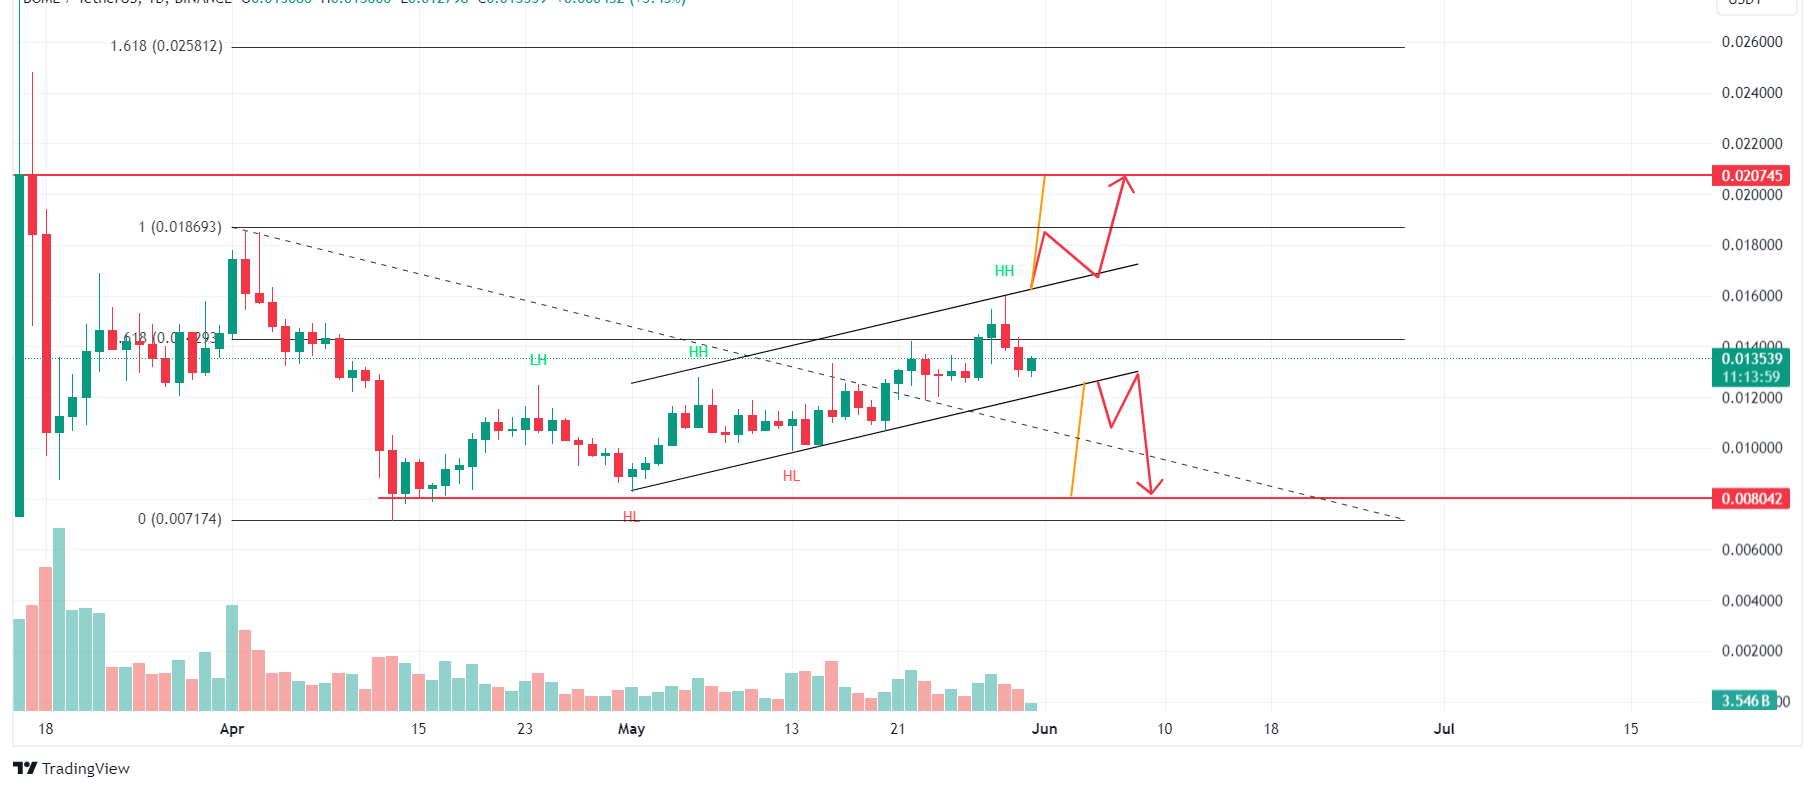
However, if the Book Of Meme price breaks below the parallel channel range, it will crash 38% to test its daily support level at $0.008.
Recommended Articles


