FLOKI whales add 30 billion tokens to their holdings in May, meme coin rises 11% on the day

Source Fxstreet
  • FLOKI rallied 11% on Tuesday, extending its seven-day gains over 40% on Binance. 
  • The meme coin has noted accumulation from large wallet holders; 30 billion FLOKI were added to whale wallets in May. 
  • FLOKI’s on-chain metrics, social dominance and active addresses support recent gains in the meme coin. 

Floki Inu (FLOKI) has noted a spike in on-chain metrics in May. The meme coin rallied alongside large market capitalization meme tokens like Dogecoin (DOGE), Shiba Inu (SHIB), Dogwifhat (WIF) and PEPE (PEPE) this cycle. 

On-chain metrics support FLOKI’s gains and the meme coin is likely to extend its rally. 

FLOKI on-chain metrics paint bullish picture

The current cycle is labeled the meme coin supercycle by market participants for the massive gains in meme tokens since the beginning of 2024. FLOKI is one such token that rallied in double-digits in the past seven days, gaining over 43% on Binance. 

At the time of writing, FLOKI price is $0.000309 and the meme coin has added 11.16% to its value on Tuesday. 

FLOKI’s price rally is supported by the surge in on-chain metrics that help determine the state of user activity, interest and the token’s relevance among traders. Two key metrics, active addresses and social dominance, have climbed between May 1 and 28, as seen on the crypto intelligence tracker Santiment’s chart. 

FLOKI’s active addresses nearly doubled from 3,650 to 7,080, and social dominance climbed from 0.0767% to 0.4953%. The increase in the two on-chain metrics supports the meme coin’s recent gains. 

FLOKI

FLOKI price, social dominance and active addresses

FLOKI extends gains, rallies in double-digits

FLOKI hit an all-time high of $0.000314 on Binance early on Tuesday. The meme token is likely to extend gains by nearly 18% if FLOKI sees a daily candlestick close above May 27 high of $0.000290. 

The target is the 127.2% Fibonacci extension of the rally from the April 13 low of $0.000109 to an all-time high on May 28 at $0.000314.

The Moving Average Convergence Divergence (MACD) indicator shows there is underlying positive momentum in FLOKI’s uptrend. The green histogram bars above the neutral line and the MACD crossing over the signal line on April 22 support a bullish thesis.  

FLOKI

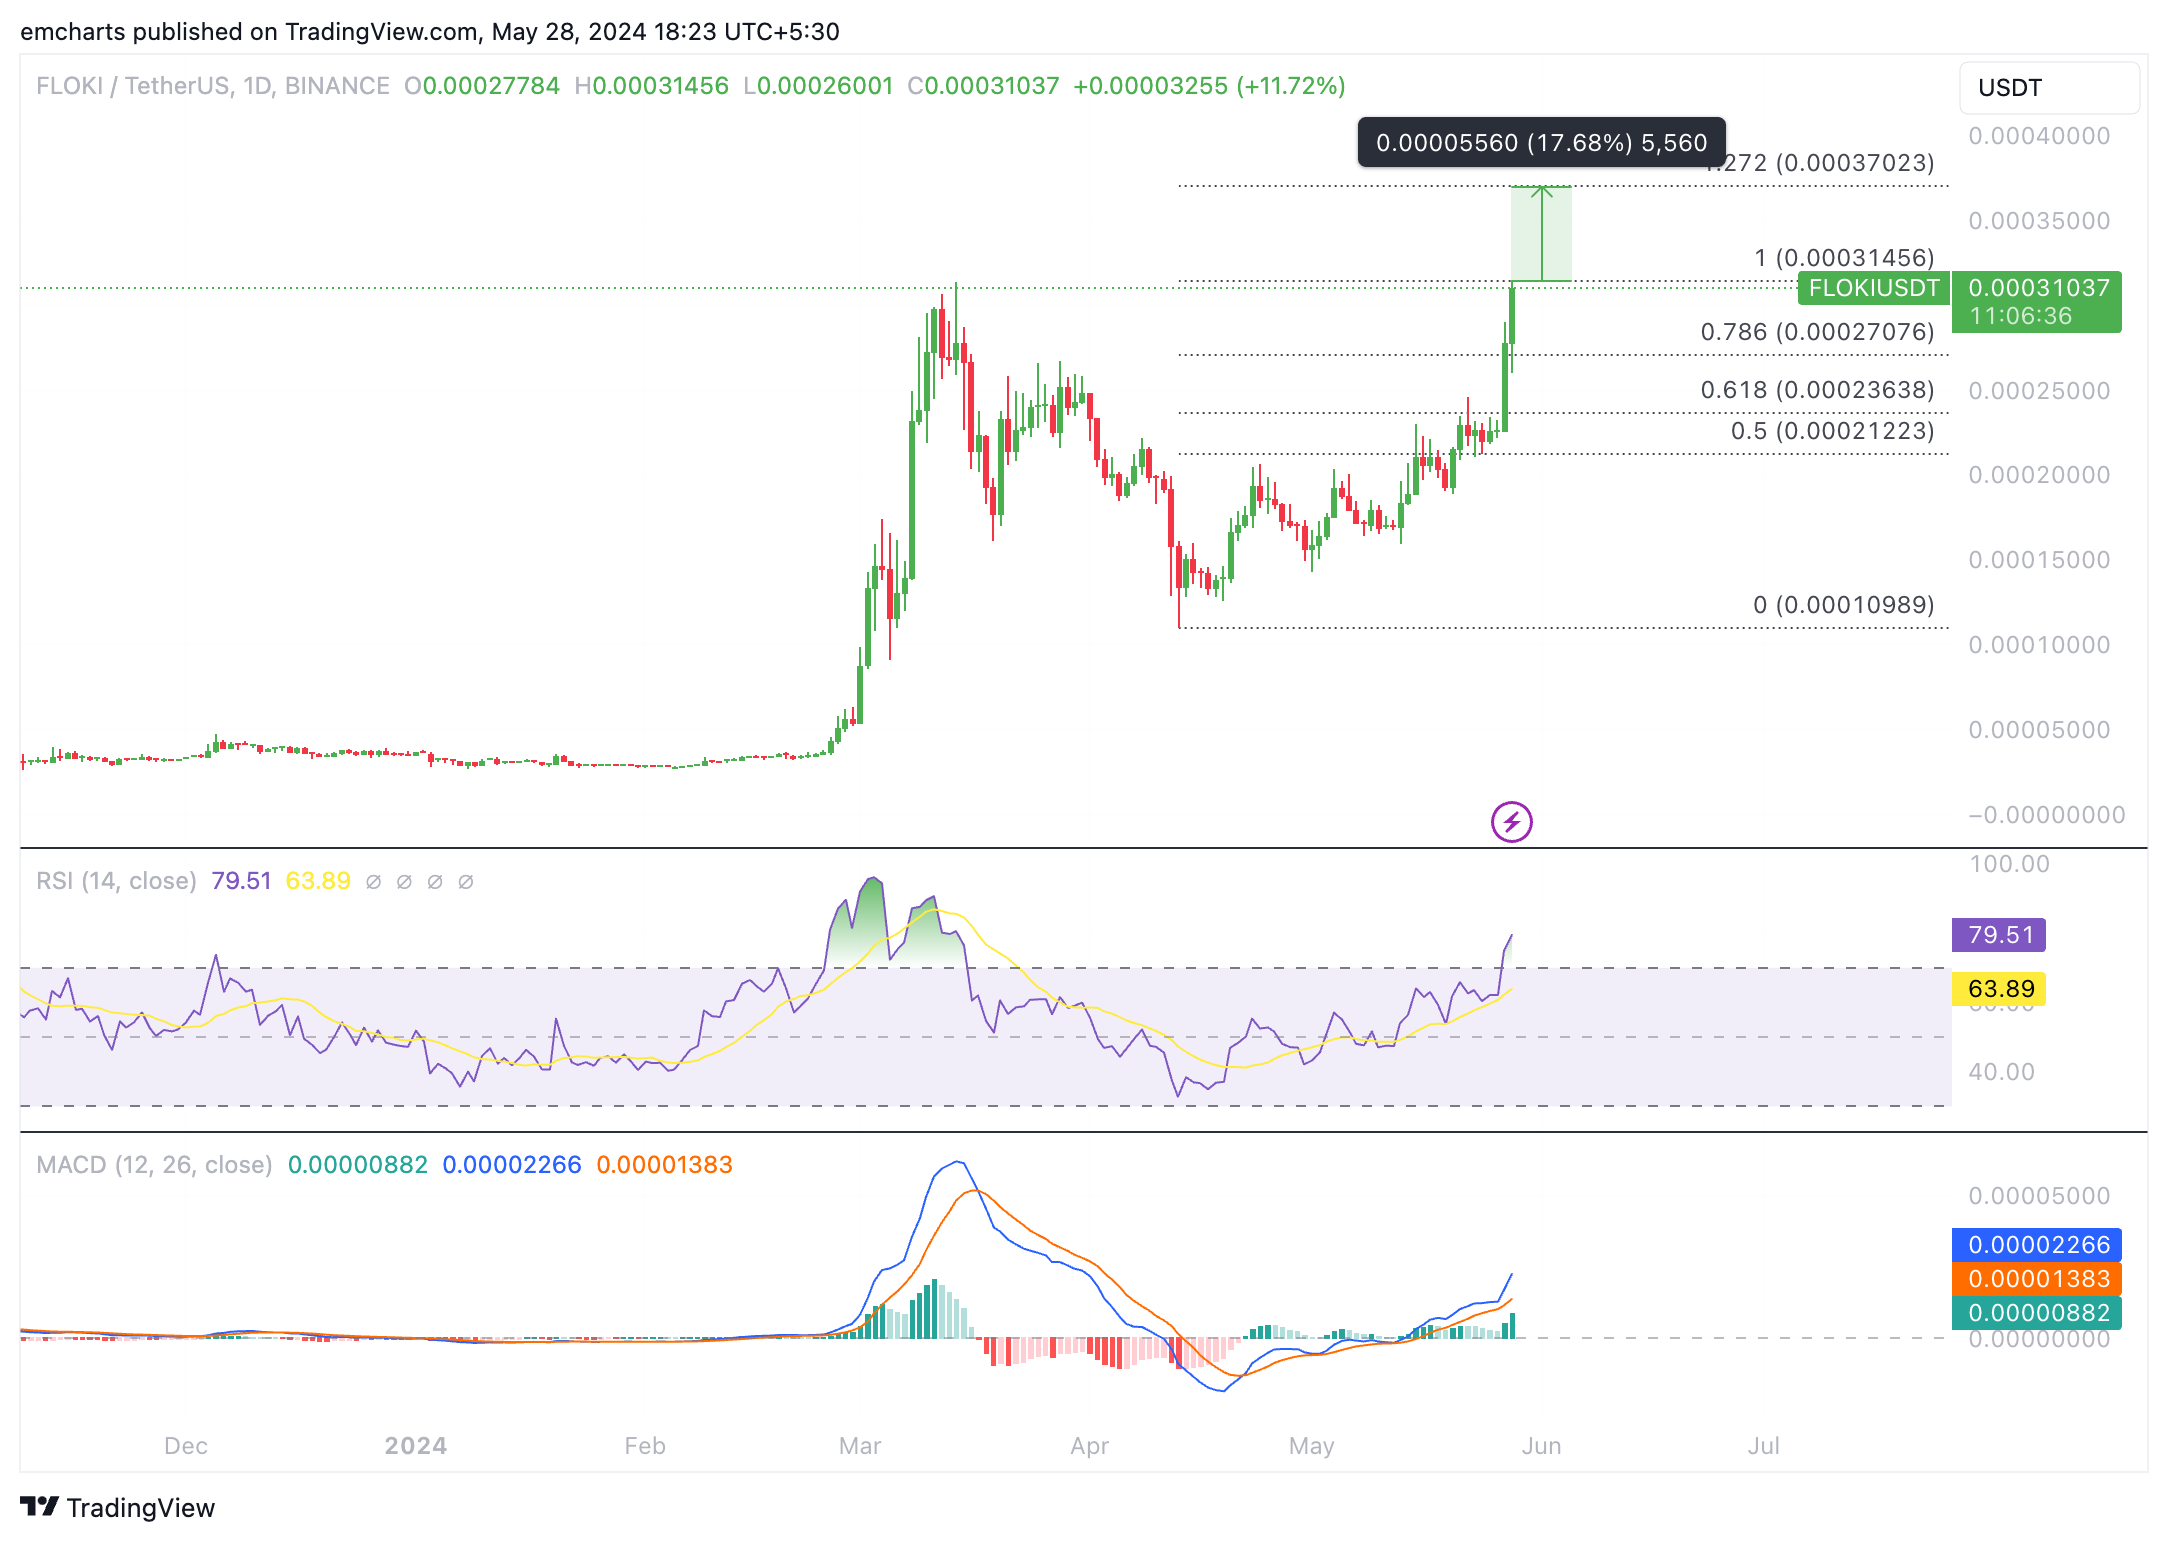
FLOKI/USDT 1-day chart 

In the event of a decline, FLOKI could find support at $0.000270, the 78.6% Fibonacci retracement of the April 13 May 28 rally. 

Disclaimer: For information purposes only. Past performance is not indicative of future results.
placeholder
Gold price declines amid risk-on sentiment despite Fed rate cut expectationsGold price (XAU/USD) continues with its struggle to find acceptance above the $3,400 mark and attracts heavy selling during the Asian session on Monday.
Author  FXStreet
Aug 11, 2025
Gold price (XAU/USD) continues with its struggle to find acceptance above the $3,400 mark and attracts heavy selling during the Asian session on Monday.
placeholder
EUR/USD Price Forecast: Keeps bullish vibe above 1.1600 despite France’s deepening political crisisThe EUR/USD pair loses ground to near 1.1620 during the early European session on Monday.
Author  FXStreet
Oct 27, 2025
The EUR/USD pair loses ground to near 1.1620 during the early European session on Monday.
placeholder
ECB Policy Outlook for 2026: What It Could Mean for the Euro’s Next MoveWith the ECB likely holding rates steady at 2.15% and the Fed potentially extending cuts into 2026, EUR/USD may test 1.20 if Eurozone growth proves resilient, but weaker growth and an ECB pivot could pull the pair back toward 1.13 and potentially 1.10.
Author  Mitrade
Dec 26, 2025
With the ECB likely holding rates steady at 2.15% and the Fed potentially extending cuts into 2026, EUR/USD may test 1.20 if Eurozone growth proves resilient, but weaker growth and an ECB pivot could pull the pair back toward 1.13 and potentially 1.10.
placeholder
Gold plummets below $4,200 as US‑Iran tensions spur hawkish rate bets ahead of US CPIGold (XAU/USD) extends the recent breakdown momentum below a technically significant 200-day Simple Moving Average (SMA) and drops to a fresh low since March 23, further below the $4,200 mark during the Asian session on Wednesday.
Author  FXStreet
22 hours ago
Gold (XAU/USD) extends the recent breakdown momentum below a technically significant 200-day Simple Moving Average (SMA) and drops to a fresh low since March 23, further below the $4,200 mark during the Asian session on Wednesday.
placeholder
BTC Hovers Near 60,000 Mark After Plunge. US May CPI Set to Be Revealed, How Is Wall Street Betting?Bitcoin's rebound falters as the U.S.-Iran conflict and CPI data likely sustain downward pressure.On June 10, escalating U.S.-Iran tensions put the already fragile crypto market to the te
Author  TradingKey
21 hours ago
Bitcoin's rebound falters as the U.S.-Iran conflict and CPI data likely sustain downward pressure.On June 10, escalating U.S.-Iran tensions put the already fragile crypto market to the te
goTop
quote