


Bitcoin Bulls Gain Breathing Room As Long-Term Holder Activity Eases – Glassnode
Bitcoin continues to dominate discussions, with its recent price movements drawing particular attention. As the asset struggles to reclaim its March all-time high of over $73,000, with recent attempts peaking above $71,000 earlier this week, the price has since receded to approximately $68,231 at the time of writing.
This retracement marks a 7.3% drop from its March peak, signifying a volatile period for the cryptocurrency, influenced by various underlying market factors.
Long-Term Holders Lessen Selling, What This Spell For BTC
Glassnode, a renowned market intelligence platform, highlights a significant development in Bitcoin’s market behavior. According to a recent analysis of the platform, there has been a notable decline in the distribution pressure from Bitcoin’s long-term holders (LTHs).
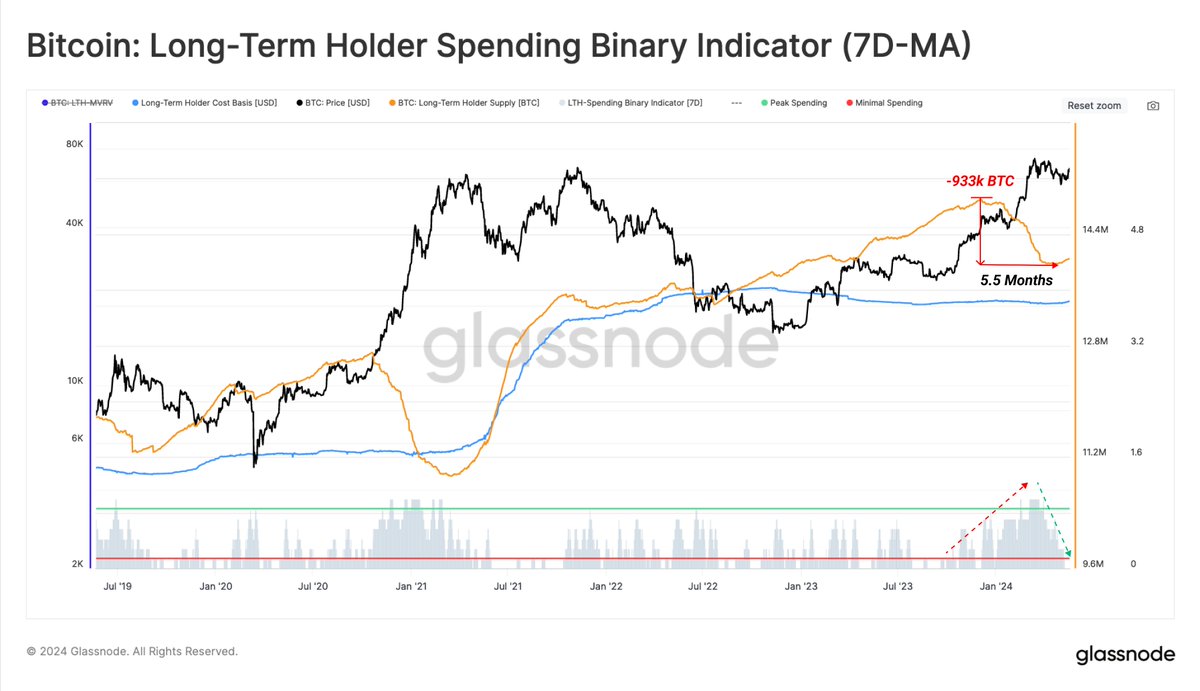
Glassnode’s “Long-Term Holder Binary Spending Indicator” tracks the sell-off activity of long-standing Bitcoin holders, and its recent data points to a marked reduction in this group’s selling pressure.
Historically, when long-term holders reduce their selling, it alleviates downward pressure on the price, potentially giving rise to more bullish market conditions.
Further insights into Bitcoin’s price behavior come from prominent crypto analyst RektCapital, who noted on social media platform X that Bitcoin typically faces resistance at the range high post-Halving and suggests a prolonged re-accumulation phase.
As the crypto asset trades just below $69,000, RektCapital discloses that Bitcoin might only break out from its current re-accumulation range around 160 days post-Halving, projecting a significant breakout as late as September 2024. This analysis is crucial as it sets expectations for investors looking for signs of Bitcoin’s next big move.
#BTC
Historically, Bitcoin has always rejected from the Range High on the first attempt at a breakout after the Halving
Moreover, history suggests this Re-Accumulation should last much longer
Bitcoin tends to breakout from these Re-Accumulation Ranges only up to 160 days after… https://t.co/Jw7FcQui2Q pic.twitter.com/beLdOPqZOi
— Rekt Capital (@rektcapital) May 24, 2024
Meanwhile, recent price action from Bitcoin has led to substantial losses for some traders, with Coinglass data showing about $41.68 million in liquidations for Bitcoin long traders and $14.34 million for short traders over the past 24 hours.
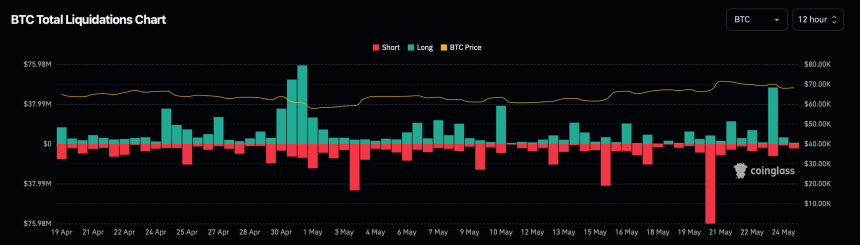
Overall, the crypto market has seen total liquidations amounting to $292.07 million during the same period, affecting 78,874 traders.
Upcoming Challenges For The Bitcoin Market
According to Greeks.Live, the imminent expiry of a significant volume of Bitcoin and Ethereum options adds another layer of complexity to the market’s immediate future. 21,000 BTC in options are set to expire soon, with a Put Call Ratio of 0.88 and a Maxpain point at $67,000, representing a notional value of $1.4 billion.
Similarly, 350,000 ETH options are nearing expiration, and their dynamics could influence the broader market due to their $1.3 billion notional value and a Put Call Ratio of 0.58.
May 24 Options Data 21,000 BTC options are about to expire with a Put Call Ratio of 0.88, Maxpain point of $67,000 and notional value of $1.4 billion. 350,000 ETH options are about to expire with a Put Call Ratio of 0.58, Maxpain point of $3,200 and notional value of $1.3… pic.twitter.com/rftA9kBm4q
— Greeks.live (@GreeksLive) May 24, 2024
In this context, a put option gives the holder the right to sell an asset at a predetermined price within a specific timeframe, which is often used as protection against a decline in the asset’s price.
Conversely, a call option offers the right to buy under similar conditions and is typically utilized in anticipation of a price increase. The Put Call Ratio is a tool that helps gauge market sentiment, with a higher ratio indicating a bearish outlook and a lower ratio suggesting bullish conditions.
Featured image created with DALL·E, Chart from TradingView
Recommended Articles


