

Ondo price shatters ATH, eyes 40% rally
- Ondo price broke ATH of $1.05 and rallied 10% in the early Asian session.
- Due to Ethereum ETF approval, the RWA narrative has come into the spotlight, with ONDO leading the charge.
- On-chain data shows bullish signs with a spike in the number of investors interacting with the Ondo blockchain.
- A weekly candlestick close below $0.87 would invalidate this bullish thesis.
Ondo (ONDO) price broke its all-time high (ATH) of $1.05 on March 31, as the US Securities and Exchange Commission (SEC) approved Ethereum’s spot Ethereum Exchange Traded Fund (ETF) applications on Thursday. With the recent uptick in ONDO, the Real World Asset (RWA) sector seems to have taken center stage.
Ondo price rally makes RWA relevant again
The US fund manager Blackrock’s entry into the crypto world with its Bitcoin spot ETF application in June 2023 catalyzed the ongoing bull run. Shortly thereafter, the American financial giant made its foray into the tokenized sector in March 2024, which kickstarted the RWA narrative, propelling tokens like Ondo, Dusk (DUSK), Centrifuge (CFG) and so on.
Due to the lack of volatility, the crypto market was stagnating, but the surprising approval of the Ethereum spot ETF by the US SEC has catalyzed alt season. Ondo, in particular, has shown incredible bullish momentum, shooting up 20% in the last 15 hours.
Data from crypto intelligence tracker DeFiLlama backs this claim by noting ONDO's staking TVL, which grew from 40 million in early March to 442 million as of this writing.
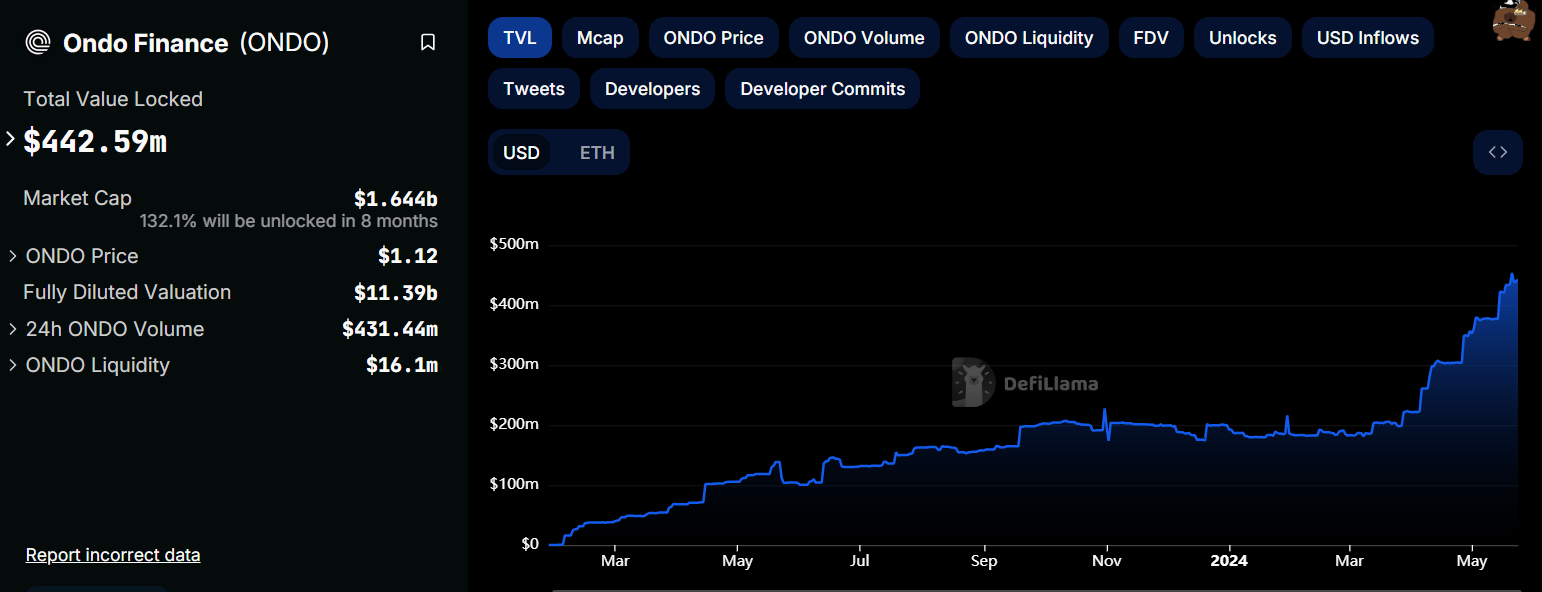
ONDO TVL chart
Ondo price shows promise
Since mid-March, the Ondo price has ranged between $0.97 and $0.69 but saw a breakout in the early Asian session on Friday.The 10% rally that led to the end of the consolidation pushed ONDO to an ATH of $1.05. Now that the RWA token is in the price discovery phase, investors can expect the existing bullish momentum to propel it to tag the 141.40% Fibonacci extension level at $1.32. This move would constitute a 25% gain.
If bulls are more aggressive and the crypto market outlook does not turn bearish, Ondo price could extend the uptrend and hit a new ATH of $1.46, representing the 161.80% Fibonacci extension level.
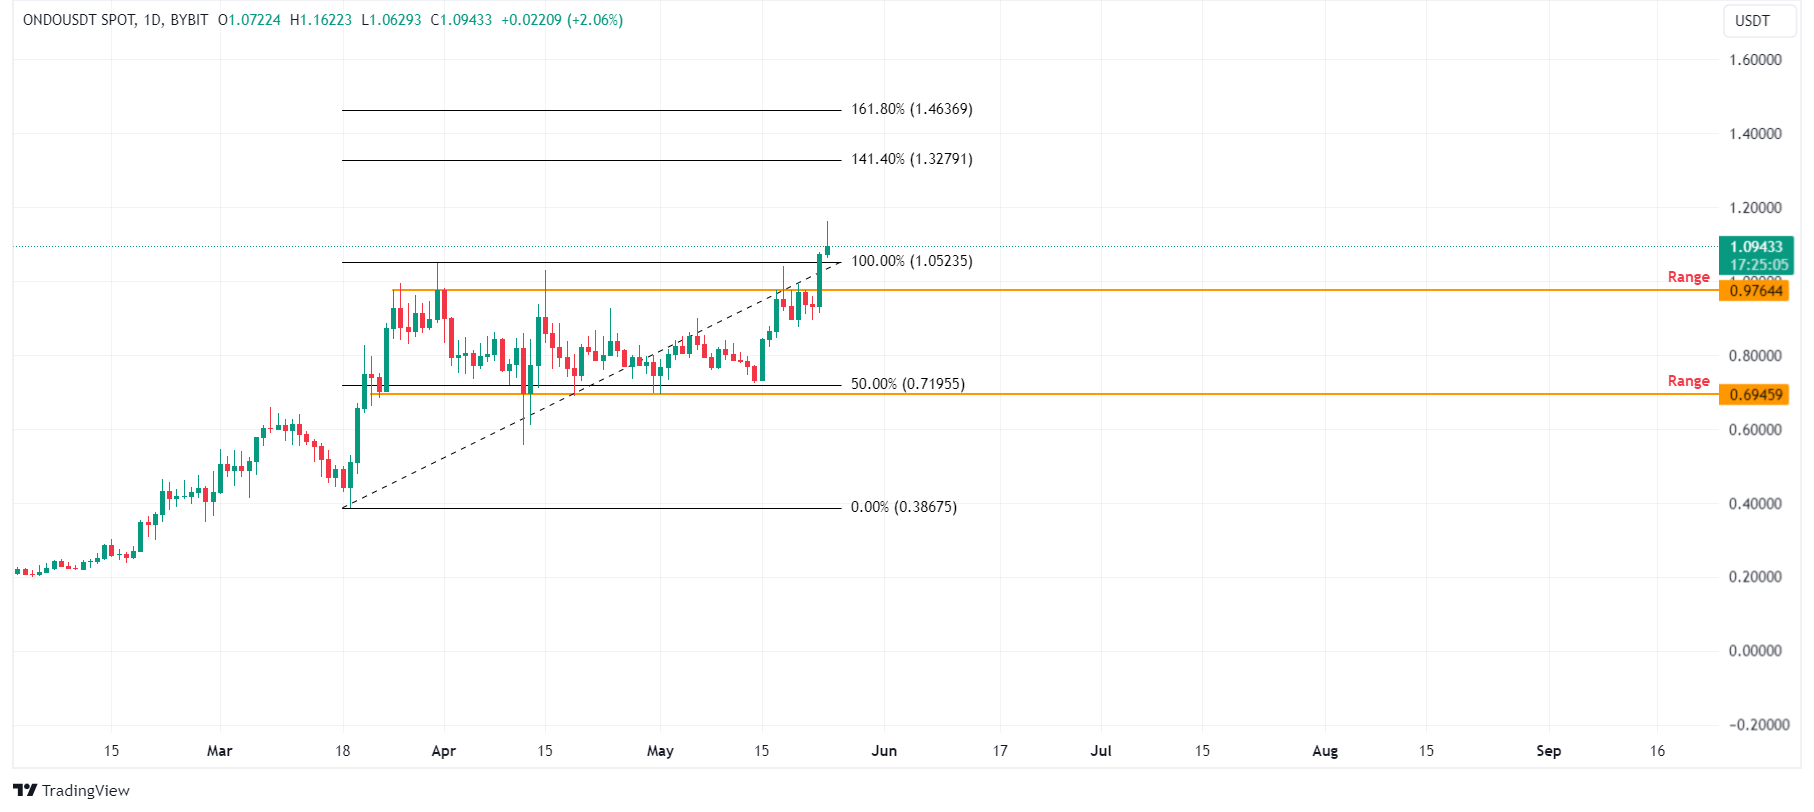
ONDO/USDT 1-day chart
Supporting this bullish thesis is IntoTheBlock’s Total With Balance metric. This index tracks the number of addresses with balance and is used to gauge the investor interest in the project. A spike in this on-chain indicator signals a robust and growing user base.
As we can see from the graph in Ondo's case, the total number of addresses with a balance grew from 35,180 to 41,300 in the past month. This 17.39% growth, despite the price consolidation indicates investors' positive outlook for Ondo price.
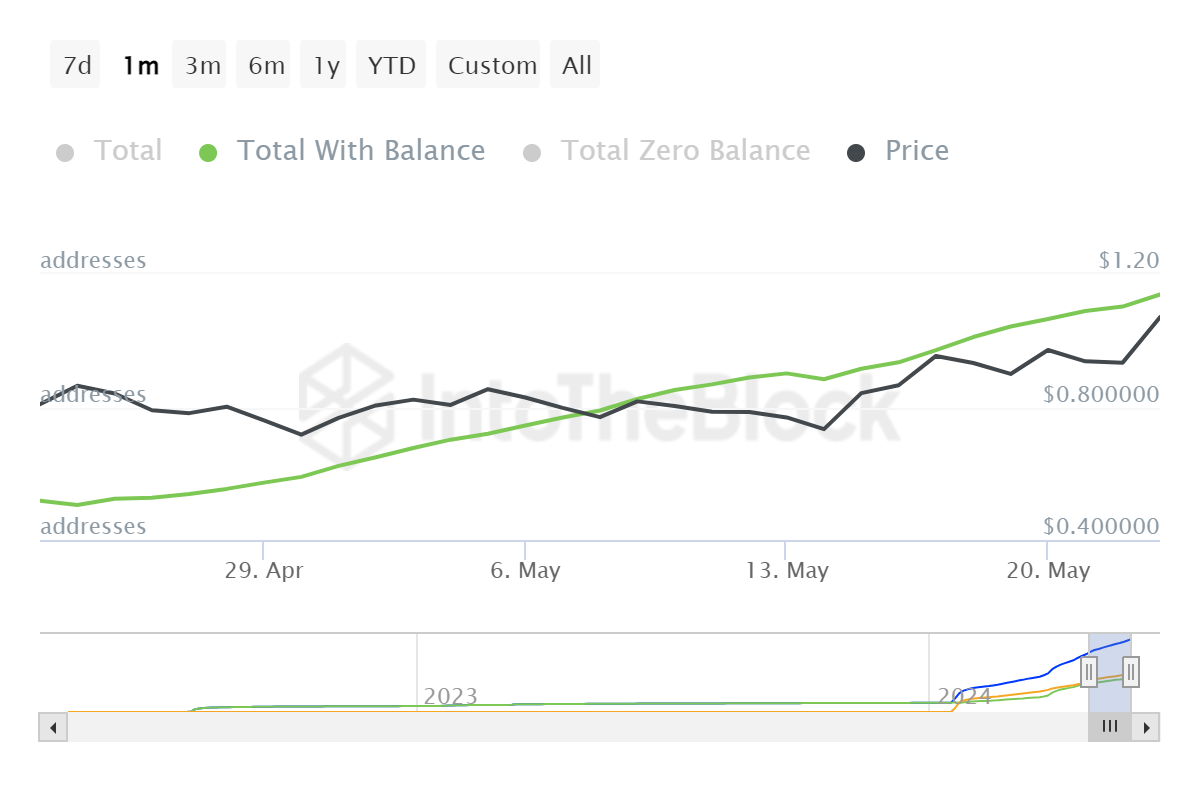
ONDO Total Addresses with Balance chart
On the contrary, if the Ondo price produces a daily candlestick close below the May 20 swing low of $0.87, it would create a lower low. The new swing low would indicate a break of the bullish market structure and invalidate the bullish thesis. In such a case, ONDO could nosedive 36% and tag the April 12 swing low of $0.55.
Recommended Articles


