

Bitcoin Will Hit $80,000 In May Despite Outflows To Ethereum: Analyst

Source Newsbtc

Bitcoin is fast-dropping, looking at price action in the daily chart. Even after the impressive spike above $71,500 early this week, there needs to be a conclusive follow-through for optimistic bulls. Despite this correction, one analyst strongly believes Bitcoin will rally sharply, reaching $80,000 by the end of the month.  

Will Bitcoin Hit $80,000 By End Of May?

Taking to X, the analyst thinks HODLers, not speculators, will reap the maximum benefits from Bitcoin. Based on the trader’s assessment, not only will BTC fly above $80,000 by the end of May, but the coin will also spike to peak at $95,000 in June.
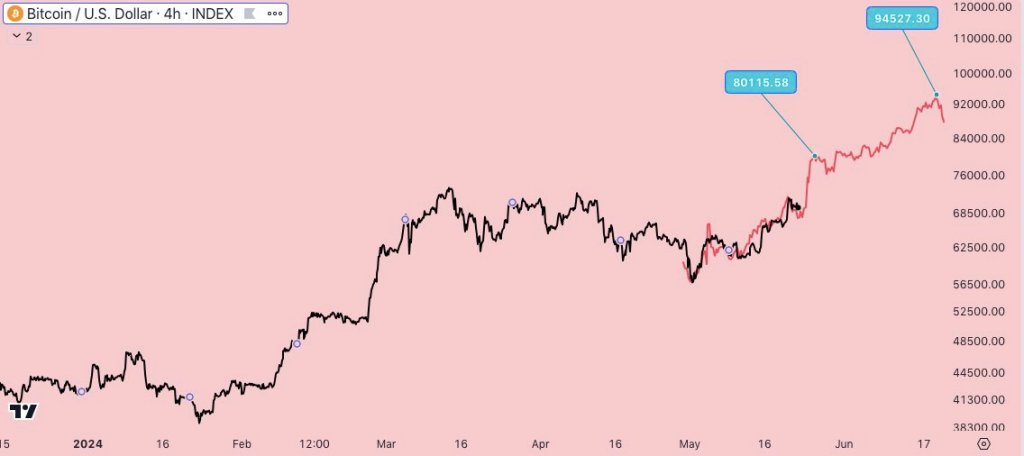
Bitcoin to hit $80,000 by May | Source: @BitQua via X

Accordingly, reading from the candlestick arrangement, those who position themselves at spot rates might enter at favorable prices, scooping the coin at a discount. Even so, when BTC flies to $95,000 in less than seven weeks from now, the trader expects prices to cool off.

The retracement will also wash out speculators hitching the leg up. 

Bitcoin price trending lower on the daily chart | Source: BTCUSDT on Binance, TradingView

At spot rates, the path of least resistance is northward. BTC is also down roughly 6% from this week’s highs, although the uptrend remains. The $72,000 line is emerging as a strong resistance level as prices continue to move horizontally. On the lower end, $60,000 is worth watching.

For the uptrend to take shape, a high volume must be close to $72,000. Of note is that bulls have yet to breach and close above this line since the surge to all-time highs in mid-March.

Capital Is Flowing To Ethereum: Will The United States SEC Reject Spot ETH ETFs?


Sentiment will play a key role in propelling prices higher. So far, the analyst acknowledges that there is a shift in sentiment. As the United States Securities and Exchange Commission (SEC) unexpectedly prepares to approve spot Ethereum exchange-traded funds (ETFs), investors have been rotating capital to ETH.

This has slowed the momentum, even lowering prices, as in the current case. The ETHBTC price chart shows that Ethereum outperforms Bitcoin, adding 25% from mid-May 2024.

There has been no official communication from the United States SEC on spot ETH ETF approval. However, the analyst believes the agency will disappoint the market by unexpectedly rejecting all proposals. Should this be the case, the crypto markets will clam up, ending what the trader claims have been “manipulative practices.”

Disclaimer: For information purposes only. Past performance is not indicative of future results.
placeholder
US August CPI lands tonight: after a 5.4% PPI shock, will the Fed hike on September 16?US August PPI came in at 5.4% year-on-year, above the 5.3% consensus, with core PPI at 4.6%. Traders have pushed the odds of a 25bp Fed hike on September 15-16 to around 70%. Tonight's CPI is the last major inflation print before the decision — here is the full calendar, the consensus numbers, and what a hot versus cool reading would mean for the dollar, yields, gold and stocks.
Author  Irene Q.
Sep 11, Fri
US August PPI came in at 5.4% year-on-year, above the 5.3% consensus, with core PPI at 4.6%. Traders have pushed the odds of a 25bp Fed hike on September 15-16 to around 70%. Tonight's CPI is the last major inflation print before the decision — here is the full calendar, the consensus numbers, and what a hot versus cool reading would mean for the dollar, yields, gold and stocks.
placeholder
Brent tests $108 as a key export pipeline stays shut — can the rally clear $110?Brent crude rose 2.55% to $106.97 and WTI 2.32% to $102.30 as a major regional export pipeline remained offline with no restart timeline. Front-month backwardation has widened to $5.53 from $3.84 a week ago, European gas is at its highest since December 2022, and one analyst sees $119.48 if talks stall.
Author  Irene Q.
Sep 14, Mon
Brent crude rose 2.55% to $106.97 and WTI 2.32% to $102.30 as a major regional export pipeline remained offline with no restart timeline. Front-month backwardation has widened to $5.53 from $3.84 a week ago, European gas is at its highest since December 2022, and one analyst sees $119.48 if talks stall.
placeholder
Fed hike odds near 90% into Wednesday's decision — how to trade the dollar, gold and the S&P 500A 0.3% monthly core CPI print has lifted the market-implied probability of a 25bp Fed hike on 16 September to roughly 86.5% ~ 90%, which would be the first increase since July 2023. Here is the decision timeline, the pricing versus the forecasts, both scenarios, and the key levels for the dollar, gold and the S&P 500.
Author  Suzie
Sep 14, Mon
A 0.3% monthly core CPI print has lifted the market-implied probability of a 25bp Fed hike on 16 September to roughly 86.5% ~ 90%, which would be the first increase since July 2023. Here is the decision timeline, the pricing versus the forecasts, both scenarios, and the key levels for the dollar, gold and the S&P 500.
placeholder
Gold falls below $4,300 as higher US yields bolster Fed rate hike betsGold price (XAU/USD) tumbles to near $4,295 during the early Asian session on Tuesday. The precious metal faces some selling pressure as rising bond yields and surging energy prices strengthen expectations that the US Federal Reserve (Fed) will raise interest rates this week. 
Author  FXStreet
Yesterday 01: 23
Gold price (XAU/USD) tumbles to near $4,295 during the early Asian session on Tuesday. The precious metal faces some selling pressure as rising bond yields and surging energy prices strengthen expectations that the US Federal Reserve (Fed) will raise interest rates this week. 
placeholder
【Daily Brief】10-year Treasury yield briefly tops 5%, S&P 500 slips to 7,602 and the dollar firms at 99.3 as the Fed's decision eve beginsThe 10-year Treasury yield touched 5.014% on Monday — its first print above 5% since October 2023 — while the S&P 500 closed 0.48% lower at 7,619.98 and the dollar index firmed to 99.3. Here is the full market wrap ahead of Wednesday's FOMC decision, the dot plot and the August retail sales report, plus today's CLARITY Act Senate vote.
Author  Irene Q.
Yesterday 08: 16
The 10-year Treasury yield touched 5.014% on Monday — its first print above 5% since October 2023 — while the S&P 500 closed 0.48% lower at 7,619.98 and the dollar index firmed to 99.3. Here is the full market wrap ahead of Wednesday's FOMC decision, the dot plot and the August retail sales report, plus today's CLARITY Act Senate vote.
goTop
quote