

Worldcoin price could rally 20% if Nvidia earnings beat estimates
- Worldcoin price is likely to rally 20% after a consolidation.
- Nvidia's earnings report on Wednesday could catalyze an upside move for WLD.
- A daily candlestick close below $4.20 would invalidate the bullish thesis.
Worldcoin (WLD) price is likely to rally after a week-long consolidation catalyzed by Nvidia’s earnings on Wednesday if these exceed estimates. Based on recent history, Nvidia (NVDA) has served as a major market mover for AI-related altcoins, including WLD, which has benefited from the chipmaker’s recent string of good earnings.
Worldcoin fortunes hinge on Nvidia
During the last earnings call on February 21, Nvidia’s earnings per share came in 12.34% higher than what analysts expected. This upside surprise supported AI coins, including Worldcoin, whose price shot up 50% between February 21 and 22.
In November, the 19.4% positive surprise in Nvidia’s earnings report also saw Worldcoin soar nearly 20% from its daily low.
If history repeats, and Nvidia’s actual earnings are higher than the estimated EPS of $5.60, AI tokens, including WLD, could climb higher.
WLD price shows promise
Worldcoin price crashed 69% from its all-time high (ATH) of $11.97 seen on March 10 and has been consolidating between $4.59 and $5.24 for more than a week. The weekly support level of $4.59 has managed to bounce WLD up by 7% to where it currently trades at $5.07.
With Nvidia earnings around the corner, a positive surprise could lead to a breakout from the rangebound movement, flipping the $5.24 hurdle into a support floor. In such a case, investors can expect WLD to rally 20% and tag the next daily resistance level at $6.30 from May 13. But the bounce could be cut short around the $6 psychological level.
On the other hand, if the earnings report is lackluster or misses estimates, the likely direction for WLD is south. This bearish development could see the AI-based altcoin revisit the range low of $4.59. In a dire case, Worldcoin price could breach the said level, triggering a 10% crash to retest the $4.20 weekly support level. This level would be a good opportunity for sidelined buyers to accumulate WLD if the outlook for the overall crypto market remains bullish.
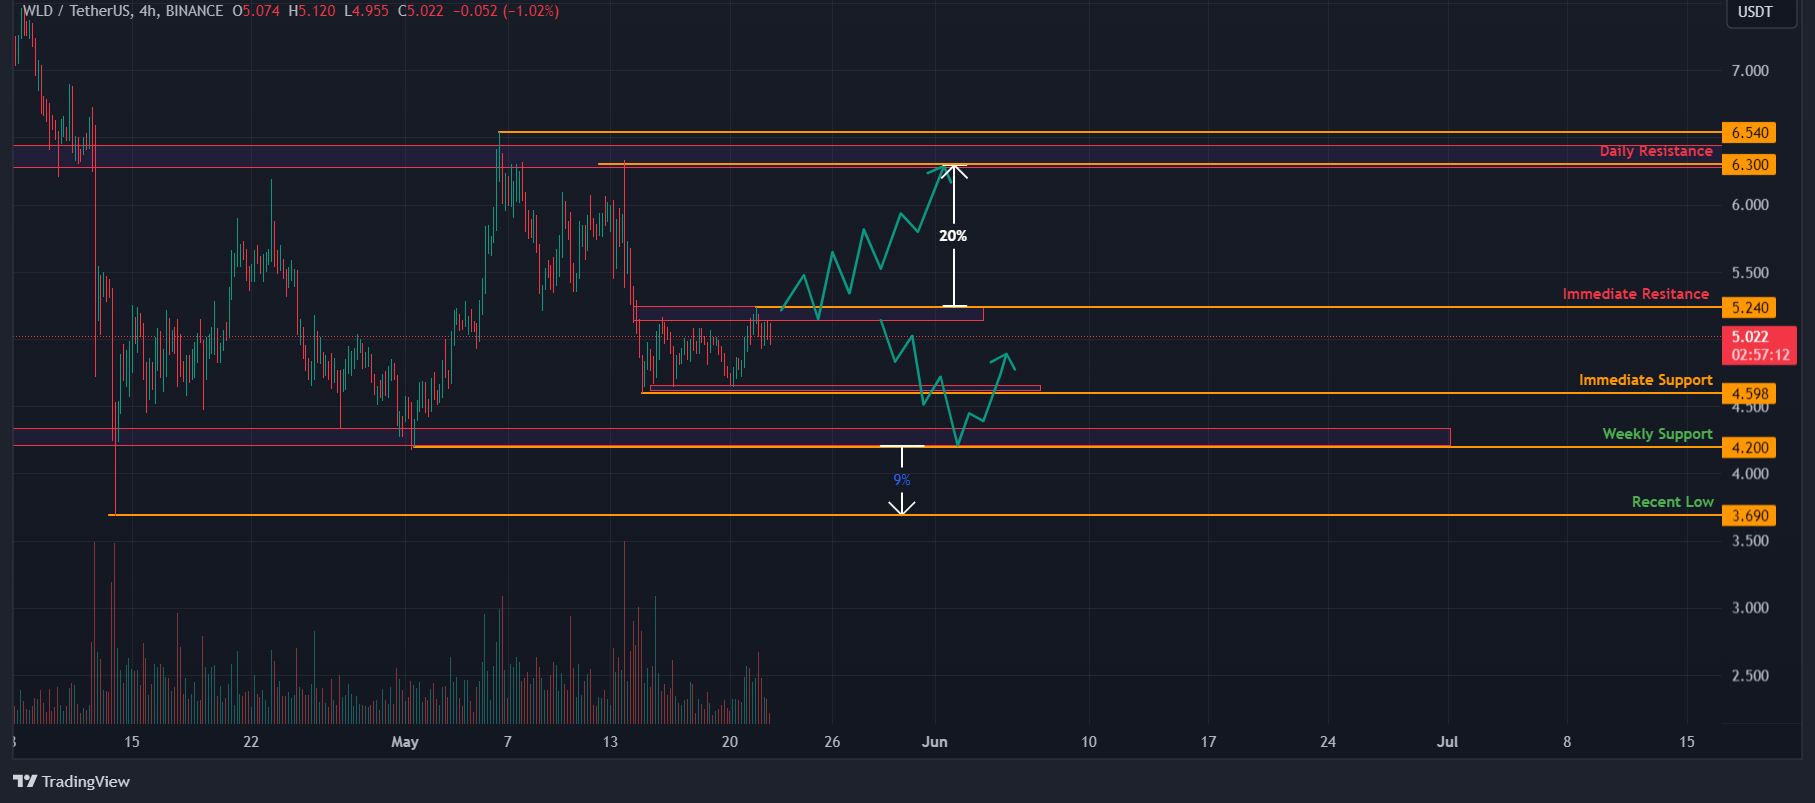
WLD/USDT 4-hour chart
Despite strong technical analysis, if the Worldcoin price produces a daily candlestick close below the $4.20 weekly support, it would denote weakness in the market. This move would create a lower low on the higher time frame and invalidate the bullish thesis. WLD could then trigger a 9% correction to the April 13 swing low of $3.69.
Recommended Articles


