

Bitcoin Whales Are Not Selling, BTC Has Strong Support Above $60,000

Source Newsbtc

Bitcoin is rising, recently breaking above $67,000, and heading towards the all-important $70,000, a psychological round number. One analyst took to X amid this uptick, noting that whales holding over 1,000 BTC are not moving their coins to exchanges. Instead, they likely expect prices to spike higher in the coming days and weeks.

Though movements over the weekend were muted, the extension earlier today is overly bullish for optimistic traders. As BTC prices edge, coin holders (and sometimes whales) usually take profits, especially if gains are shaky and not as strong.

Whales Are Not Selling, More Gains Expected?

However, the current cycle looks like whales are holding on, expecting prices to recover strongly. The analyst notes that the 30-day average is 641 BTC, with the reading decreasing sharply from mid-2023. 
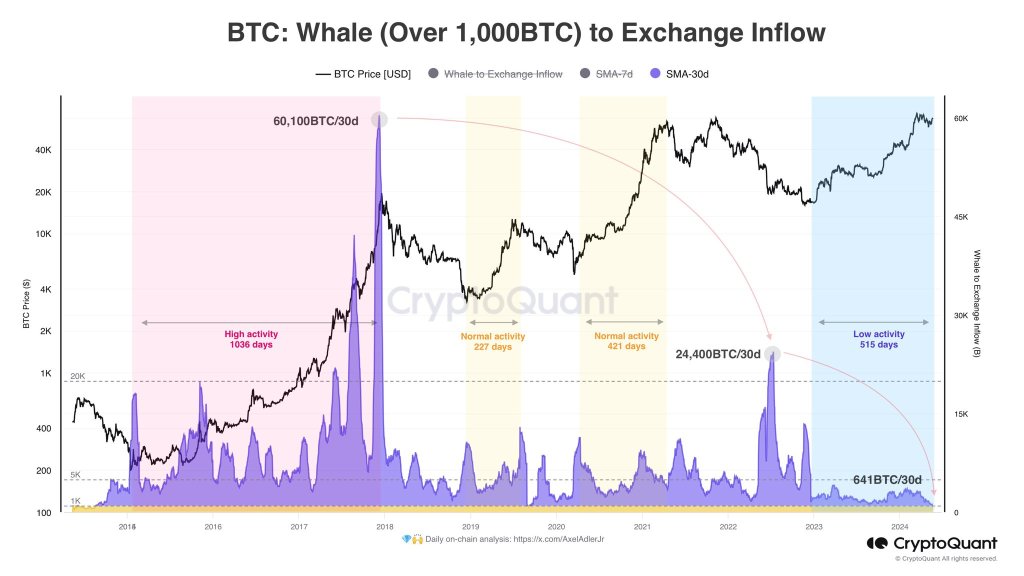
BTC whales are holding | Source: @AxelAdlerJr on X

This means that whales are bullish and unmoved by short-term price movements. Though this observation doesn’t necessarily mean bulls expect a moonshot, they are holding cement the outlook that prices might move higher in the coming sessions. 

Accompanying the breakout above $66,0000, on-chain data shows that the Market Value to Realize Value (MVRV) ratio is also rising. According to the analyst, the MVRV ratio for those who have held BTC for between 1 and 3 months has climbed above 66,500. 

This expansion means they have exited the “unrealized loss” zone, signaling a shift in sentiment among short-term holders. At spot rates and prices trading above $66,700, above the $66,500 level, HODLers are in the green and can exit for a profit or HODL.

Bitcoin Finds Strong Support Above $60,000

It remains to be seen how prices will react in the short to medium term. However, another analyst notes that over 530,000 BTC was traded at $66,250. Accordingly, this line is turning out to be a strong, reliable support. If bulls soak in the selling pressure, the line at $66,250 can act as a reliable anchor for the next leg up toward an all-time high. 

Bitcoin price trending upward on the daily chart | Source: BTCUSDT on Binance, TradingView

Analysts agree that the zone above $60,000 is a reliable support level. Taking to X, another analyst said that the Bitcoin Short-Term Holder Cost Basis (STHCB) is rising and stands at $60,700. Historically, the STHCB has acted as a dynamic support during bull runs and resistance in bear markets. 
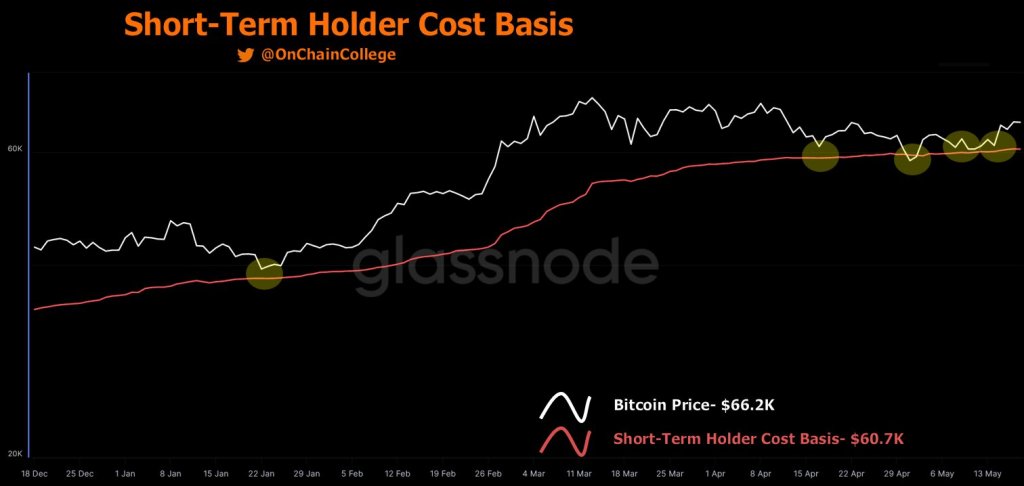
Bitcoin short term holder basis | Source: @OnChainCollege on X

In on-chain analysis, the STHCB is a metric that tracks the average price at which short-term holders (those holding BTC for less than 180 days, bought their coins.

Historically, the STHCB has acted as a support level during bull runs and a resistance level during bear markets. Currently, the STHCB sits at $60.7K and is steadily increasing, suggesting a potential floor for the price.

Disclaimer: For information purposes only. Past performance is not indicative of future results.
placeholder
Brent Crude Oil Price Forecast: Trump Eases Sanctions on Russia, Oil Prices Under Pressure Below $110, Can They Still Rise?On Monday (October 19), Brent (UKOIL) crude oil prices fell noticeably at the open today after a sharp rally last Friday. As of press time, oil prices were down about 2.1%, trading near $
Author  TradingKey
5 hours ago
On Monday (October 19), Brent (UKOIL) crude oil prices fell noticeably at the open today after a sharp rally last Friday. As of press time, oil prices were down about 2.1%, trading near $
placeholder
Bitcoin's double top at $88,000: why $78,000 is the line that decides the next moveBitcoin trades near $82,500 (+0.47%) after twice failing at the $88,000 area, forming a potential double top with a neckline at $78,000. A break below the neckline would project a measured target near $68,200; a close back above $88,000 would invalidate the pattern. Here are the structure, the levels and what would confirm either side.
Author  Suzie
8 hours ago
Bitcoin trades near $82,500 (+0.47%) after twice failing at the $88,000 area, forming a potential double top with a neckline at $78,000. A break below the neckline would project a measured target near $68,200; a close back above $88,000 would invalidate the pattern. Here are the structure, the levels and what would confirm either side.
placeholder
Brent slips from $110 as Russian supply prospects return — is the five-month rally over?Brent crude traded near $108.06 on Monday (-1.71%), pulling back from last week's $110 high after Washington moved to ease restrictions on Russian oil flows. WTI hovered around $101 before dipping below $99. The retreat is real, but so is the supply-risk premium: Hormuz shipping disruptions, attacks on Saudi energy infrastructure and strikes on Russian refineries remain live. Here are the three numbers, the transmission chain and the levels that matter.
Author  Irene Q.
9 hours ago
Brent crude traded near $108.06 on Monday (-1.71%), pulling back from last week's $110 high after Washington moved to ease restrictions on Russian oil flows. WTI hovered around $101 before dipping below $99. The retreat is real, but so is the supply-risk premium: Hormuz shipping disruptions, attacks on Saudi energy infrastructure and strikes on Russian refineries remain live. Here are the three numbers, the transmission chain and the levels that matter.
placeholder
Gold retests $4,200 as dollar and yields retreat — can bullion clear its hardest level?Spot gold traded near $4,175 on Monday (+0.23%), with an intraday high of $4,187.71 after last week's $4,073 ~ $4,217 range; COMEX futures briefly topped $4,200. The dollar slipped to 101.76 and 10-year yields eased from their highs, but October Fed hike odds near 52% and BofA's sub-$4,000 call still cap the upside. Here are the drivers, the levels and what would flip the script.
Author  Irene Q.
9 hours ago
Spot gold traded near $4,175 on Monday (+0.23%), with an intraday high of $4,187.71 after last week's $4,073 ~ $4,217 range; COMEX futures briefly topped $4,200. The dollar slipped to 101.76 and 10-year yields eased from their highs, but October Fed hike odds near 52% and BofA's sub-$4,000 call still cap the upside. Here are the drivers, the levels and what would flip the script.
placeholder
Gold Price Analysis Today | Forex Gold Analysis | XAU/USD Analysis - October 19, 2026Get the latest gold price analysis, forex gold insights, and XAU/USD analysis for October 19, 2026. Read on for the details.
Author  Mitrade
13 hours ago
Get the latest gold price analysis, forex gold insights, and XAU/USD analysis for October 19, 2026. Read on for the details.
goTop
quote