

Ondo TVL rises with a market cap reaching $1.32 billion amid strong utility in RWA
- ONDO price has surged 13% in 24 hours sending its market capitalization to $1.32 billion.
- Ondo Finance TVL has reached $420.89 million, up nearly 20% in May and almost 40% in a month.
- Strong utility in RWA facilitating creation of decentralized fund management strategies is among possible catalysts.
Ondo Finance (ONDO) price has been on a bullish streak since inception in January, with a sustained series of higher highs. The token’s success is likely attached to the mania that is Real World Assets (RWAs), with ONDO standing in line alongside Polymesh (POLYX), XinFin Network (XDC), Mantra DAO (OM), and Opulous (OPUL).
Also Read: POLYX, XDC, OM, ONDO, OPUL: Top 5 cryptos on watchlist as RWA finance platforms take form
Ondo Finance TVL Skyrockets
Ondo Finance price is up 13% in the past 24 hours, a move that has sent its market capitalization to $1.32 billion.
When the market capitalization of a cryptocurrency increases, it indicates that the overall value of that particular cryptocurrency has grown. This rise in market capitalization can be driven by various factors such as increased demand from investors, positive news or developments related to the cryptocurrency project, adoption by mainstream institutions, or overall market sentiment.
A higher market capitalization generally suggests that there is more investment in the cryptocurrency and that it is gaining popularity and acceptance within the market. This is the case for ONDO.
Alongside the surge in price and market capitalization, Ondo Finance Total Value Locked (TVL) has also skyrocketed to $420.89. This is no mean feat, considering the project is barely five months old.
It is up 20% since the start of May at $352.67 million, and 40% in the past 30 days from $303.35 million on April 17.

ONDO TVL
A rise in TVL refers to an increase in the total monetary value of assets locked in DeFi protocols or platforms. TVL represents the total value of all cryptocurrency assets being utilized for various purposes within the DeFi ecosystem, such as lending, borrowing, providing liquidity, yield farming, and other decentralized financial activities.
A rise in TVL is typically seen as a positive indicator for the DeFi space as it signifies growing interest and participation in decentralized finance applications. It can be driven by factors such as increasing adoption of DeFi platforms, new projects launching innovative products, attractive yields and incentives offered to users, and overall market trends.
The popularity of ONDO comes on the back of its categorization under RWA tokens. This sector of cryptocurrencies tokenizes established commodities from traditional finance and brings them over into the DeFi space using blockchain technology.
Standing among the top five RWA finance platforms poised to change the game, Ondo Finance has been a beast of a platform, displaying significant strength on the charts.
It facilitates the creation of decentralized fund management strategies. It allows for diversified exposure across various DeFi assets.
The platform splits principal and yield returns between fixed and variable tranches, providing options for both conservative and risk-seeking investors. Ondo enhances liquidity provision by offering structured products in DeFi investment.
Technical analysis: ONDO price primed for more gains
Ondo Finance price remains above the Fibonacci Golden Zone, with the most significant retracement level, 61.8%, providing crucial support at $0.7239. The immediate support is the 78.6% Fibonacci retracement level of $0.8673.
With the Ondo Finance price confronting resistance due to the trendline of the Fibonacci retracement indicator, enhanced buyer momentum could see the price overcome this roadblock to reclaim the $1.0500 range high, last tested on March 31. Such a move would constitute a 10% climb above current levels.
The Relative Strength Index (RSI) is climbing, suggesting rising momentum. Its position above the mean level of 50 also accentuates the bullish thesis. Notably, the Awesome Oscillator (AO) has moved into positive territory above the mean level, showing that bullish sentiment is strengthening.
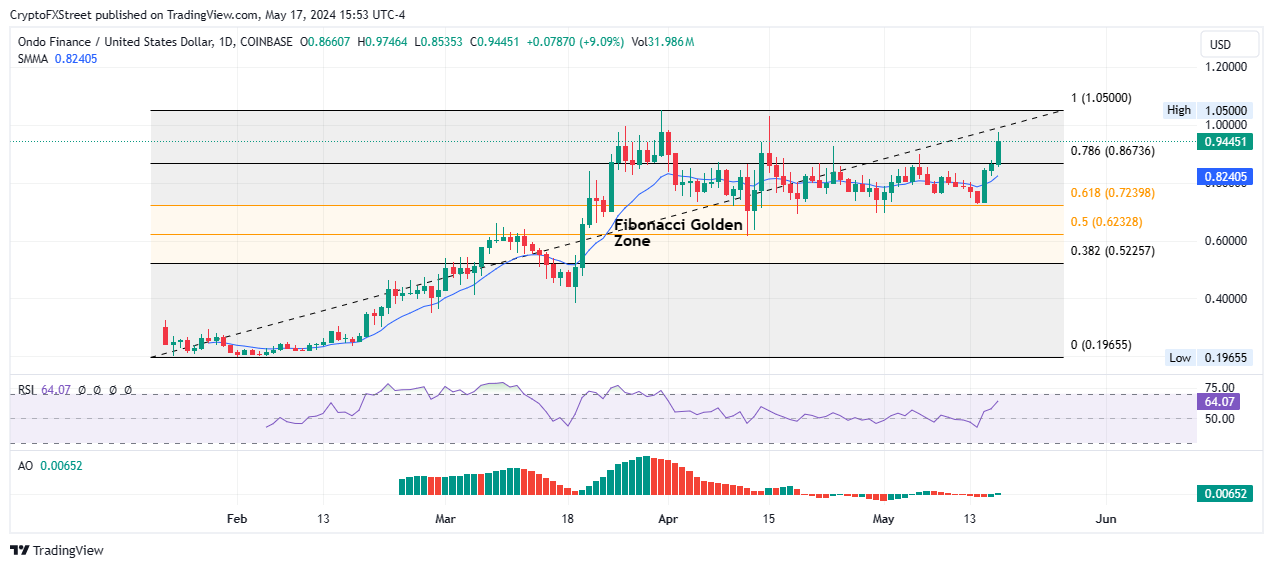
ONDO/USDT 1-day chart
Conversely, a rejection from the trendline could see the RWA token lose support offered by the 78.6% Fibonacci retracement level of $0.8673. If the subsequent support due to the Smooth Moving Average (SMMA) at $0.8240 fails to hold, ONDO price could to the 61.8% Fibonacci retracement level of $0.7239.
A slip below this base would send ONDO price into the Golden Zone, but the bullish thesis would only be invalidated upon a daily candlestick close below the 50% Fibonacci placeholder at $0.6232. This would denote a fall of nearly 35% below current levels.
Recommended Articles


