

Bitcoin price reclaims territory above $64K after April CPI release
- Bitcoin price is up nearly 5% to tag $65,000, a level last tested on May 6.
- CPI report shows inflation eased in April, falling to 3.4% after March reading at 3.5%.
- Core CPI came in at 3.6% vs. 3.8% last month, both aligning with expectations and clearly bullish for BTC.
Bitcoin (BTC) price has shown strength, displaying a god candle on Wednesday during the early hours of the American session. Notably, it is an interesting turn considering how poorly BTC has been performing during this session in the recent weeks.
Also Read: Bitcoin Price Outlook: Will GameStop stock resurgence have downstream effect on BTC and alts?
Daily digest market mover: April CPI release pushes Bitcoin above $64,000
Bitcoin price showed strength on Wednesday after the April inflation reading by the US Bureau of Labor Statistics (BLS).
Per the report, inflation has declined from 3.5% to 3.4% on a yearly basis in April, measured by the change in the Consumer Price Index (CPI). This is in line with what markets expected. The annual core CPI also dropped from 3.8% to 3.6% in the same period.
#Bitcoin has pumped +3.5% since the CPI data for April revealed some slight easing by inflation. pic.twitter.com/6MuMzSTmDM
— Satoshi Stacker (@StackerSatoshi) May 15, 2024
Economist and global strategist Peter Schiff says, “…all economic and other data point to much larger CPI increases in the future,” adding, “If the Fed needs a bogus excuse to cut rates, investors are hoping this qualifies.”
There is nothing to celebrate about today's April #CPI release. Up .3% annualizes to an #inflation rate near 4%. But all economic and other data point to much larger CPI increases in the future. If the #Fed needs a bogus excuse to cut rates, investors are hoping this qualifies.
— Peter Schiff (@PeterSchiff) May 15, 2024
However, with the surge in the Bitcoin price, 53,079 traders were liquidated, Coinglass reports, adding that the total liquidations come in at $120.55 million.
The surge in Bitcoin price is ascribed to speculation and market sentiment. Traders and investors interpret the news of softened inflation as a signal that central banks may maintain loose monetary policy, which could benefit riskier assets like Bitcoin.
Technical analysis: Bitcoin price must record a stable close above $65,500 for market structure change
Bitcoin price has recorded a god candle in the one-day timeframe. This is a massive green candle, signaling a bullish trend as it represents robust buying pressure. It comes after a sequence of lower highs, which means the ongoing rally could culminate in a change in market structure.
For this to happen, however, Bitcoin price must break and close above $65,500 on the one-day time frame. The Relative Strength Index (RSI) is also posting higher lows, suggesting growing bullish momentum. This coupled with the Awesome Oscillator (AO), whose histogram bars are green and pulling toward positive territory, suggests bullish sentiment is growing.
Further, the DXY Compare indicator continues to nosedive, which is interpreted as investors being more willing to take on riskier assets like Bitcoin when they perceive less uncertainty in the US dollar (USD).
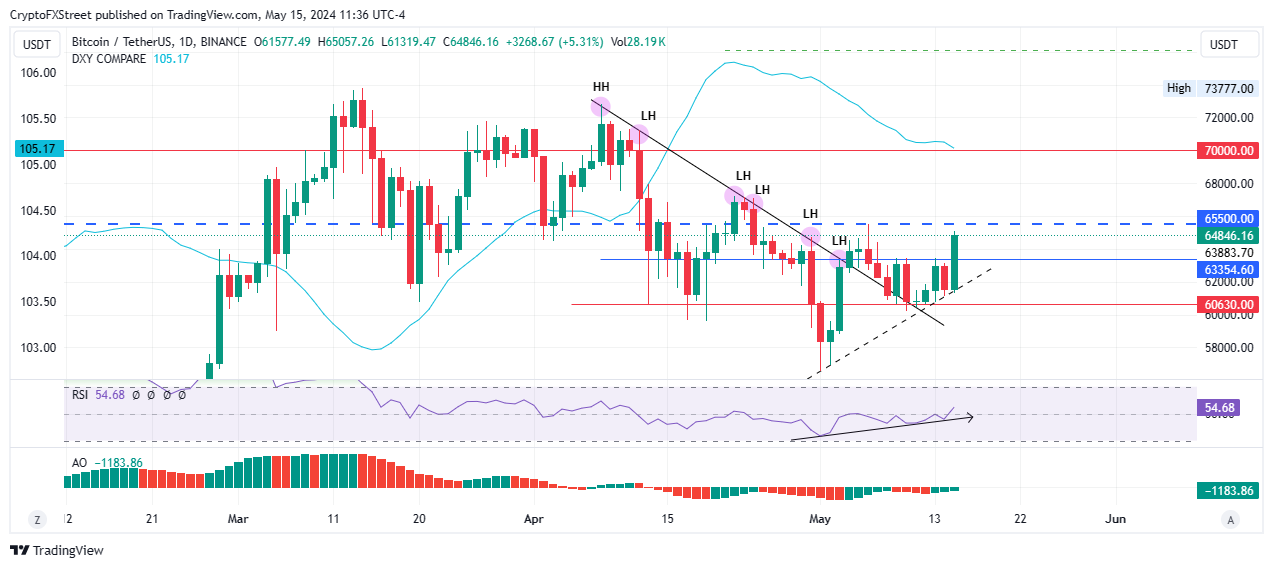
BTC/USDT 1-day chart
Conversely, a rejection from the $65,500 threshold could cause a retraction in Bitcoin price. A slip below $60,630 would encourage panic selling, potentially sending BTC lower to $58,000 or, in a dire case, the May 1 lows of $56,552. This would denote a fall of nearly 13% below current levels.
Bitcoin, altcoins, stablecoins FAQs
Bitcoin is the largest cryptocurrency by market capitalization, a virtual currency designed to serve as money. This form of payment cannot be controlled by any one person, group, or entity, which eliminates the need for third-party participation during financial transactions.
Altcoins are any cryptocurrency apart from Bitcoin, but some also regard Ethereum as a non-altcoin because it is from these two cryptocurrencies that forking happens. If this is true, then Litecoin is the first altcoin, forked from the Bitcoin protocol and, therefore, an “improved” version of it.
Stablecoins are cryptocurrencies designed to have a stable price, with their value backed by a reserve of the asset it represents. To achieve this, the value of any one stablecoin is pegged to a commodity or financial instrument, such as the US Dollar (USD), with its supply regulated by an algorithm or demand. The main goal of stablecoins is to provide an on/off-ramp for investors willing to trade and invest in cryptocurrencies. Stablecoins also allow investors to store value since cryptocurrencies, in general, are subject to volatility.
Bitcoin dominance is the ratio of Bitcoin's market capitalization to the total market capitalization of all cryptocurrencies combined. It provides a clear picture of Bitcoin’s interest among investors. A high BTC dominance typically happens before and during a bull run, in which investors resort to investing in relatively stable and high market capitalization cryptocurrency like Bitcoin. A drop in BTC dominance usually means that investors are moving their capital and/or profits to altcoins in a quest for higher returns, which usually triggers an explosion of altcoin rallies.
Recommended Articles


