


XRP sustains gains as pro-Ripple attorneys discuss discounts offered to institutional clients
- The SEC calls for legally mandated repayment of gains from discounts offered by Ripple to institutional clients.
- Ripple offered different discounts to institutional clients, the SEC expects the firm to pay back “ill-gotten gains.”
- XRP consolidates and sustains above $0.50 on Wednesday.
Ripple (XRP) price consolidates in a tight range around $0.50 on Wednesday as the Securities and Exchange Commission (SEC) legal battle against payment-remittance firm Ripple intensifies with two key issues in focus this week.
The first issue is the fines to be imposed on the payment firm for alleged violations of securities laws by sale of XRP to institutional clients. The second is the issue of “disgorgement” or ill-gotten gains from different discounts offered to Ripple’s institutional clients.
Daily Digest Market Movers: Ripple’s alleged “ill-gotten gains” take center stage in lawsuit discussion
- Pro-crypto attorneys behind the X handle James Murphy, known as @MetaLawMan, and Bill Morgan, as @Belisarius2020, are debating the SEC’s stance on Ripple’s gains from offering different discounts to institutional clients.
- The regulator considers these “ill-gotten gains” and asks for mandated repayment of the disgorgement in their recent lawsuit filing.
- The SEC’s proposal had asked the court to order Ripple Labs to pay $876 million in disgorgement, alongside $198 million in prejudgment interest and a civil penalty of $876 million.
- The fines amount to a total of $1.95 billion.
have a listen. The SEC wants to make Ripple ‘s sophisticated institutional customers richer at Ripple’s expense by the remedy of disgorgement. This is just one anomaly of many of this crazy lawsuit that is literally protecting nobody. https://t.co/pSwrURfxAB
— bill morgan (@Belisarius2020) May 14, 2024
- Ripple asked to seal the discounts offered to its institutional clients to protect its interest, in the recent Omnibus letter motions filed on Monday.
- There is no fixed date for the court’s ruling on the penalty to be imposed on the firm.
Technical analysis: XRP sustains above $0.50, likely to decline
Ripple price is in a state of decline since last week as XRP wiped out nearly 13% of its value since the May 6 high of $0.5703. XRP has sustained above support at $0.50 since then, however, the Moving Average Convergence Divergence (MACD) indicator shows negative momentum in the altcoin’s price trend.
The red histogram bars below the neutral line and the crossover of the signal line above MACD on Sunday support a bearish narrative for XRP.
Relative Strength Index (RSI) reads 40.72, still far from oversold levels and leaving more room for a further decline.
XRP could sweep support at $0.4717, the 23.6% Fibonacci retracement of the decline between the April 9 top of $0.6431 and the April 13 bottom of $0.4188. This would mark a nearly 6% correction in Ripple price from current levels.
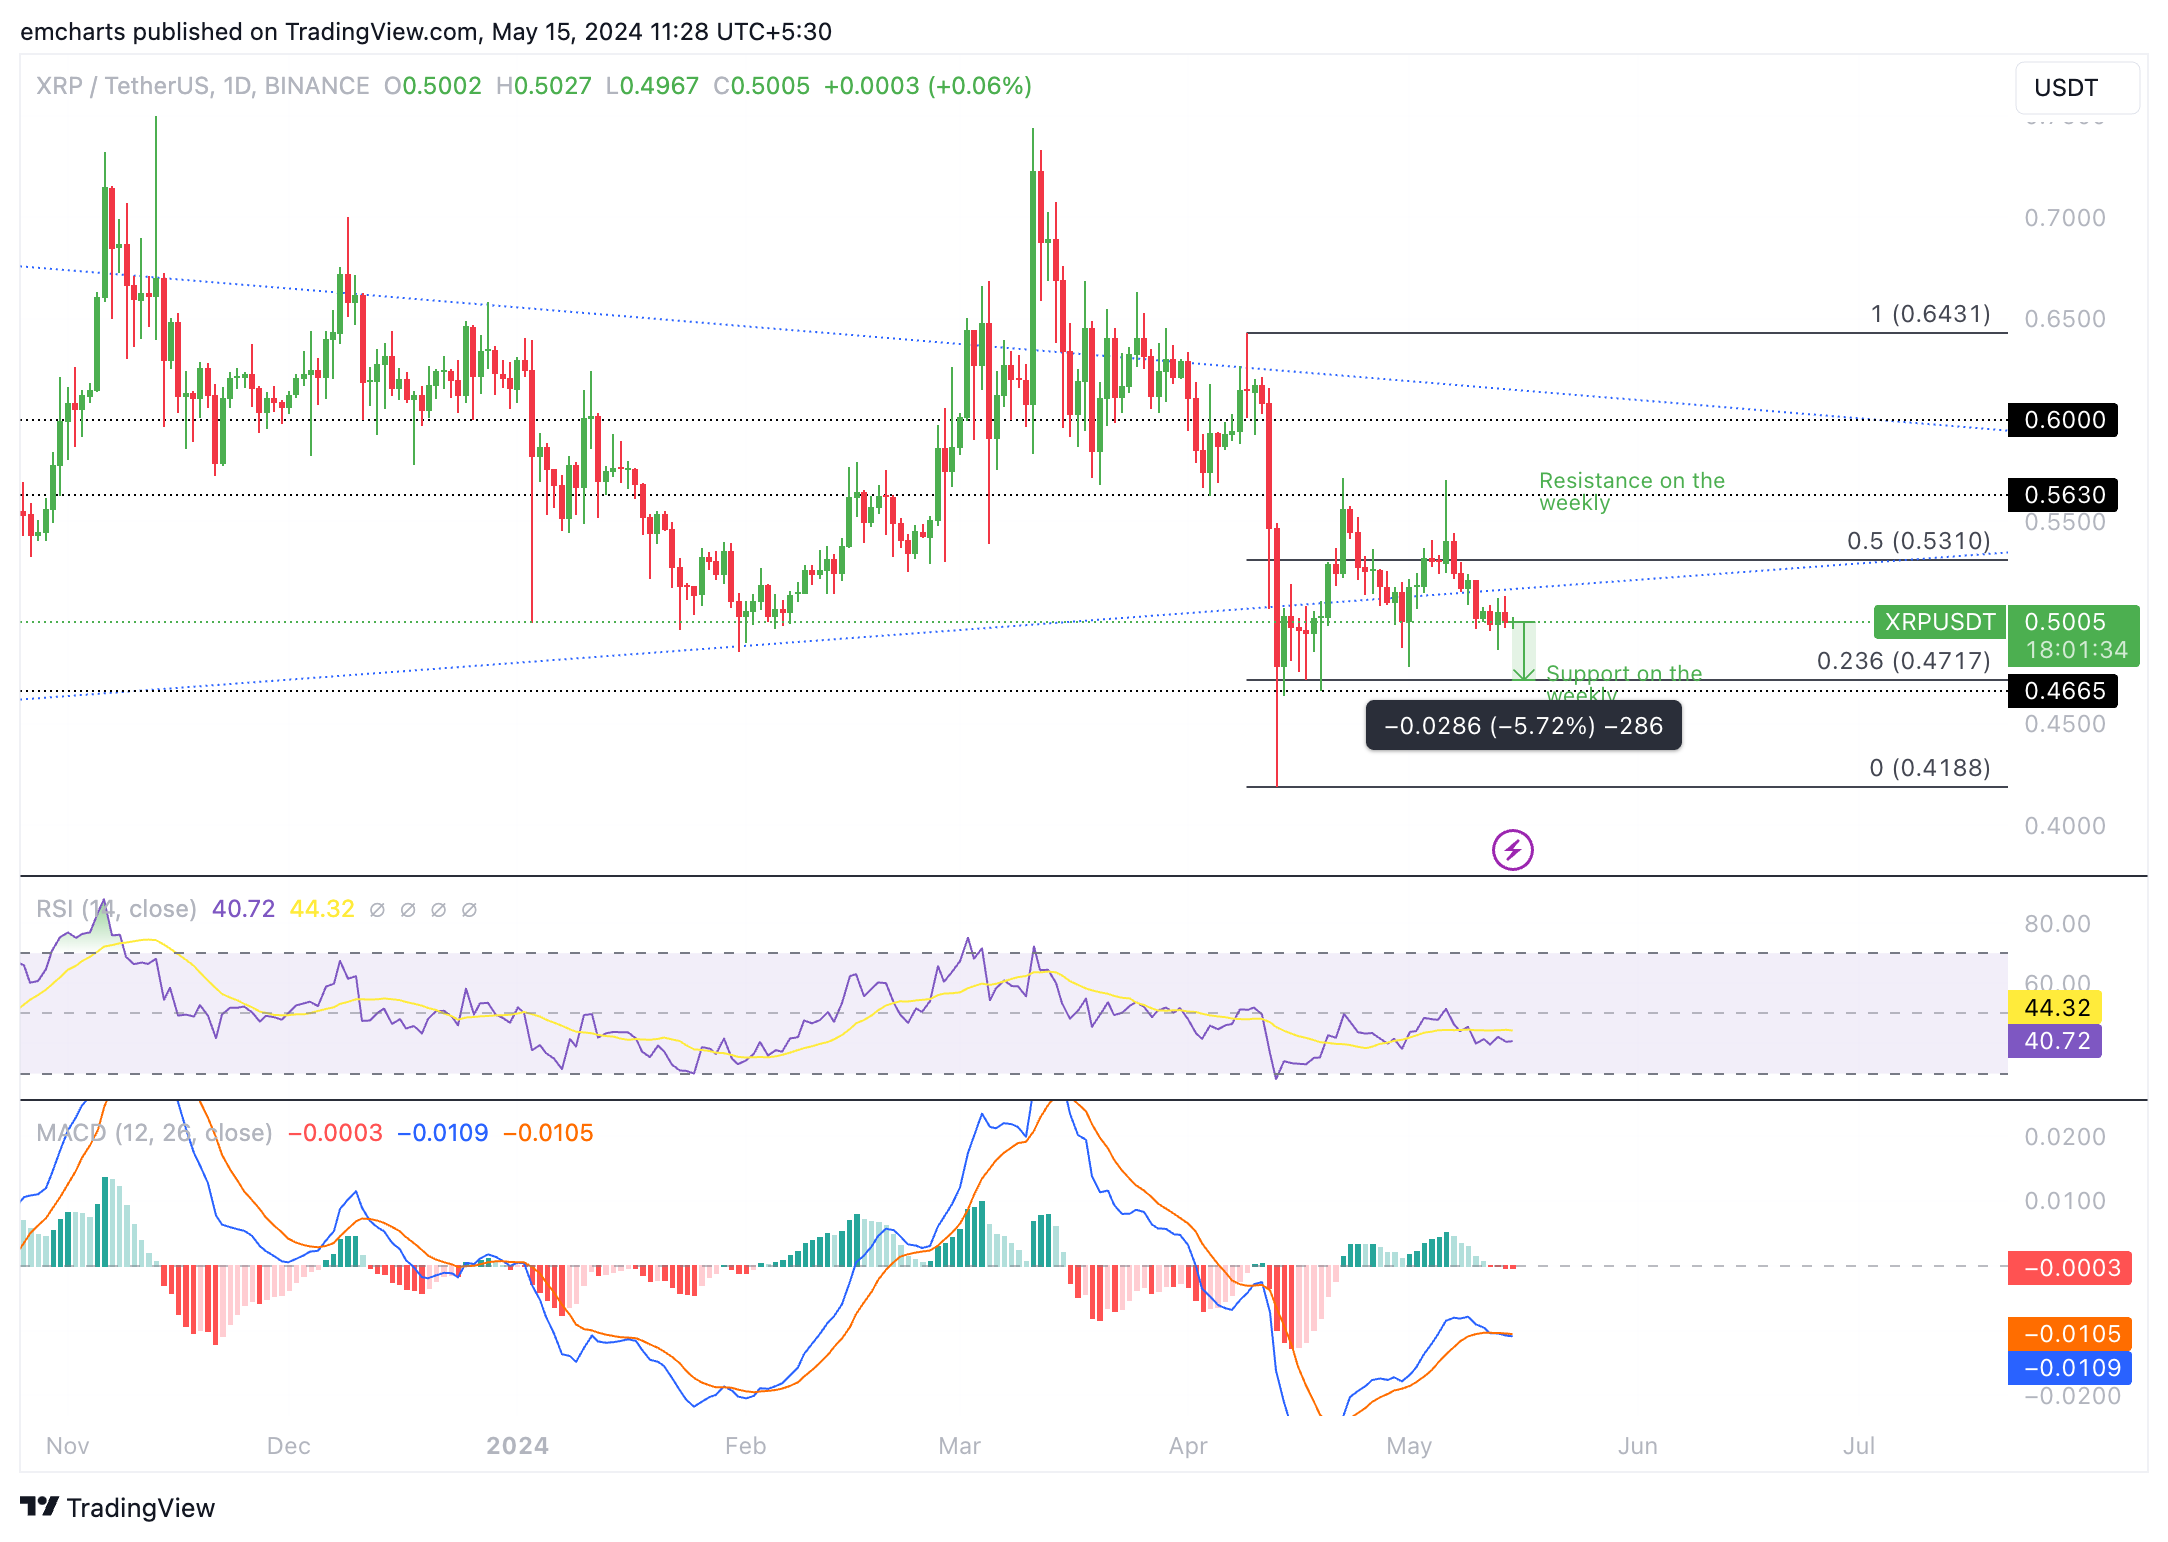
XRP/USDT 1-day chart
Looking up, a daily candlestick close above $0.5045, the 38.2% Fibonacci retracement of Ripple’s decline between April 9 and April 13, could invalidate the bearish thesis. XRP could rally towards the resistance at $0.5310, the 50% Fibonacci retracement of the aforementioned movement.
Bitcoin, altcoins, stablecoins FAQs
Bitcoin is the largest cryptocurrency by market capitalization, a virtual currency designed to serve as money. This form of payment cannot be controlled by any one person, group, or entity, which eliminates the need for third-party participation during financial transactions.
Altcoins are any cryptocurrency apart from Bitcoin, but some also regard Ethereum as a non-altcoin because it is from these two cryptocurrencies that forking happens. If this is true, then Litecoin is the first altcoin, forked from the Bitcoin protocol and, therefore, an “improved” version of it.
Stablecoins are cryptocurrencies designed to have a stable price, with their value backed by a reserve of the asset it represents. To achieve this, the value of any one stablecoin is pegged to a commodity or financial instrument, such as the US Dollar (USD), with its supply regulated by an algorithm or demand. The main goal of stablecoins is to provide an on/off-ramp for investors willing to trade and invest in cryptocurrencies. Stablecoins also allow investors to store value since cryptocurrencies, in general, are subject to volatility.
Bitcoin dominance is the ratio of Bitcoin's market capitalization to the total market capitalization of all cryptocurrencies combined. It provides a clear picture of Bitcoin’s interest among investors. A high BTC dominance typically happens before and during a bull run, in which investors resort to investing in relatively stable and high market capitalization cryptocurrency like Bitcoin. A drop in BTC dominance usually means that investors are moving their capital and/or profits to altcoins in a quest for higher returns, which usually triggers an explosion of altcoin rallies.
Recommended Articles


