

Cardano Price Forecast: ADA sets the stage for a 20% rally
- Cardano price hovers inside a range, extending from $0.433 to $0.521.
- A sweep of the range low seems likely before ADA starts a recovery rally to $0.521.
- A decisive flip of the $0.433 support floor into a resistance level will invalidate the bullish thesis.
Cardano (ADA) price has been in a consolidative phase for nearly a month. This sideways movement comes after a near 40% crash in early April. Going forward, a bounce in Bitcoin could see altcoins, including ADA, trigger a recovery rally.
Also read: Cardano on-chain indicators flash buy signals
Cardano price ready to move higher
Cardano price crashed 37% between April 9 and 13, along with the entire crypto market. After this sudden spike in selling pressure alleviated, ADA slipped into a rangebound movement between $0.433 and $0.521.
As Cardano price hovers around the range low, investors can expect ADA to sweep the range low at $0.433 to collect the sell side liquidity resting below equal lows. This move might seem bearish at the time, but if it is followed by a quick and decisive recovery above $0.433, it would be a buy signal.
This range low sweep is a move often employed by market makers or smart money to trap retail investors in the wrong direction.
Hence, a recovery above $0.433 will likely be followed by an impulsive move that tags the range high at $0.521. This move recovery rally would constitute a 20% gain. However, in a highly bullish case, ADA could attempt a retest of the daily resistance level at $0.576, constituting a 33% gain measure from $0.433.
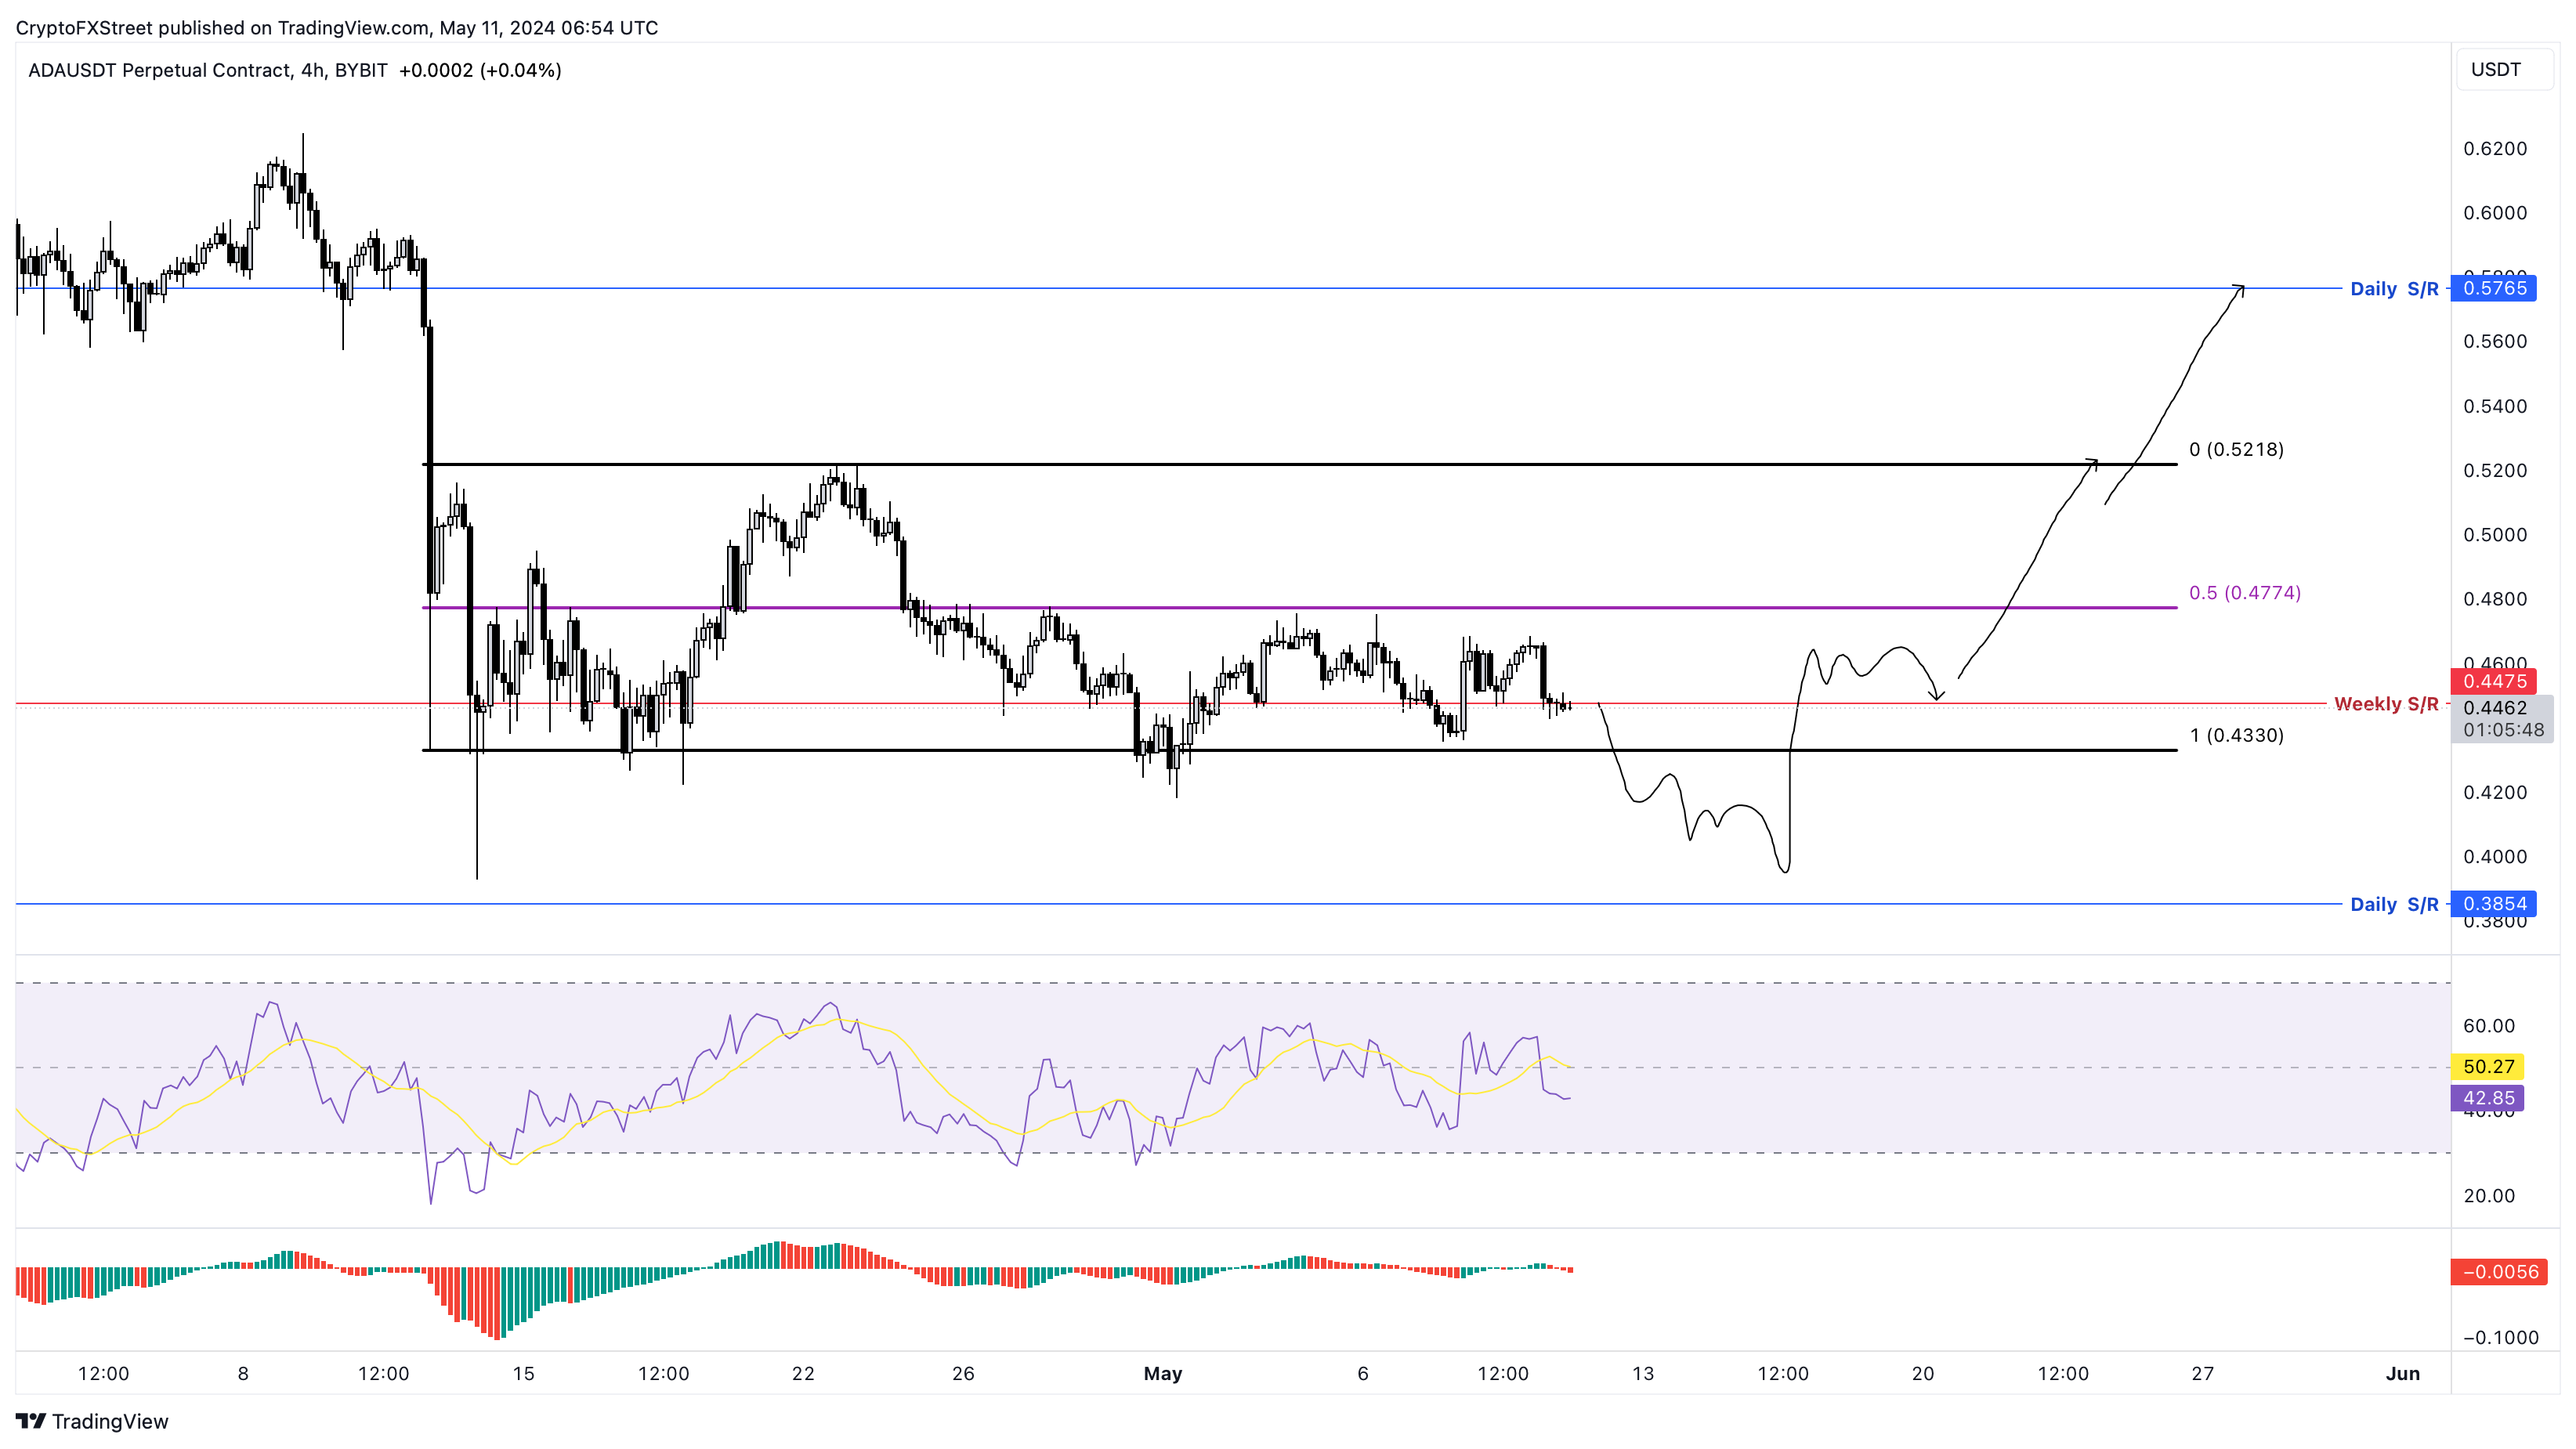
ADA/USDT 4-hour chart
If Cardano price slips below $0.433 but fails to recover above it, it would signal a weakness in the market. This move would produce a lower low and a lower high, suggesting a shift in the market structure favoring bears. Hence, the bullish thesis will face invalidation if it loses the $0.433 support floor.
This development is likely to be followed by Cardano price finding support around $0.385 level, which is roughly 10% away from $0.433.
Recommended Articles


