

Tom Lee’s BitMine Holds 4.66 Million ETH but Can’t Escape a 6-Month Slide
BitMine Immersion Technologies (BMNR) stock is trading near $21.24, up just 4% over the past month, while Ethereum (ETH), the asset that underpins its entire treasury, has gained 14% in the same period.
That performance gap reveals a negative upside beta, where BMNR fails to capture ETH’s rallies but remains exposed to its declines. Three technical signals explain why the disconnect persists and what it would take to close it.
Weak Ethereum Beta Keeps BitMine Trapped
BeInCrypto’s exclusive BMNR-ETH proxy indicator on the daily chart shows the correlation between BitMine stock price and Ethereum sitting at 0.57, with a smoothed reading of 0.36. While that correlation is positive, the beta to ETH reads -0.26, which means BMNR is moving in the opposite direction of Ethereum on a magnitude basis.
This negative beta explains the monthly performance gap. When ETH rallied 14%, BMNR captured only a fraction of that upside. The stock has been locked inside a descending parallel channel on the daily chart since early October, a 6-month downtrend that has compressed the price from above $65 to the current $21 range, a 68% slide.
Want more insights like this? Sign up for Editor Harsh Notariya’s Daily Crypto Newsletter here.
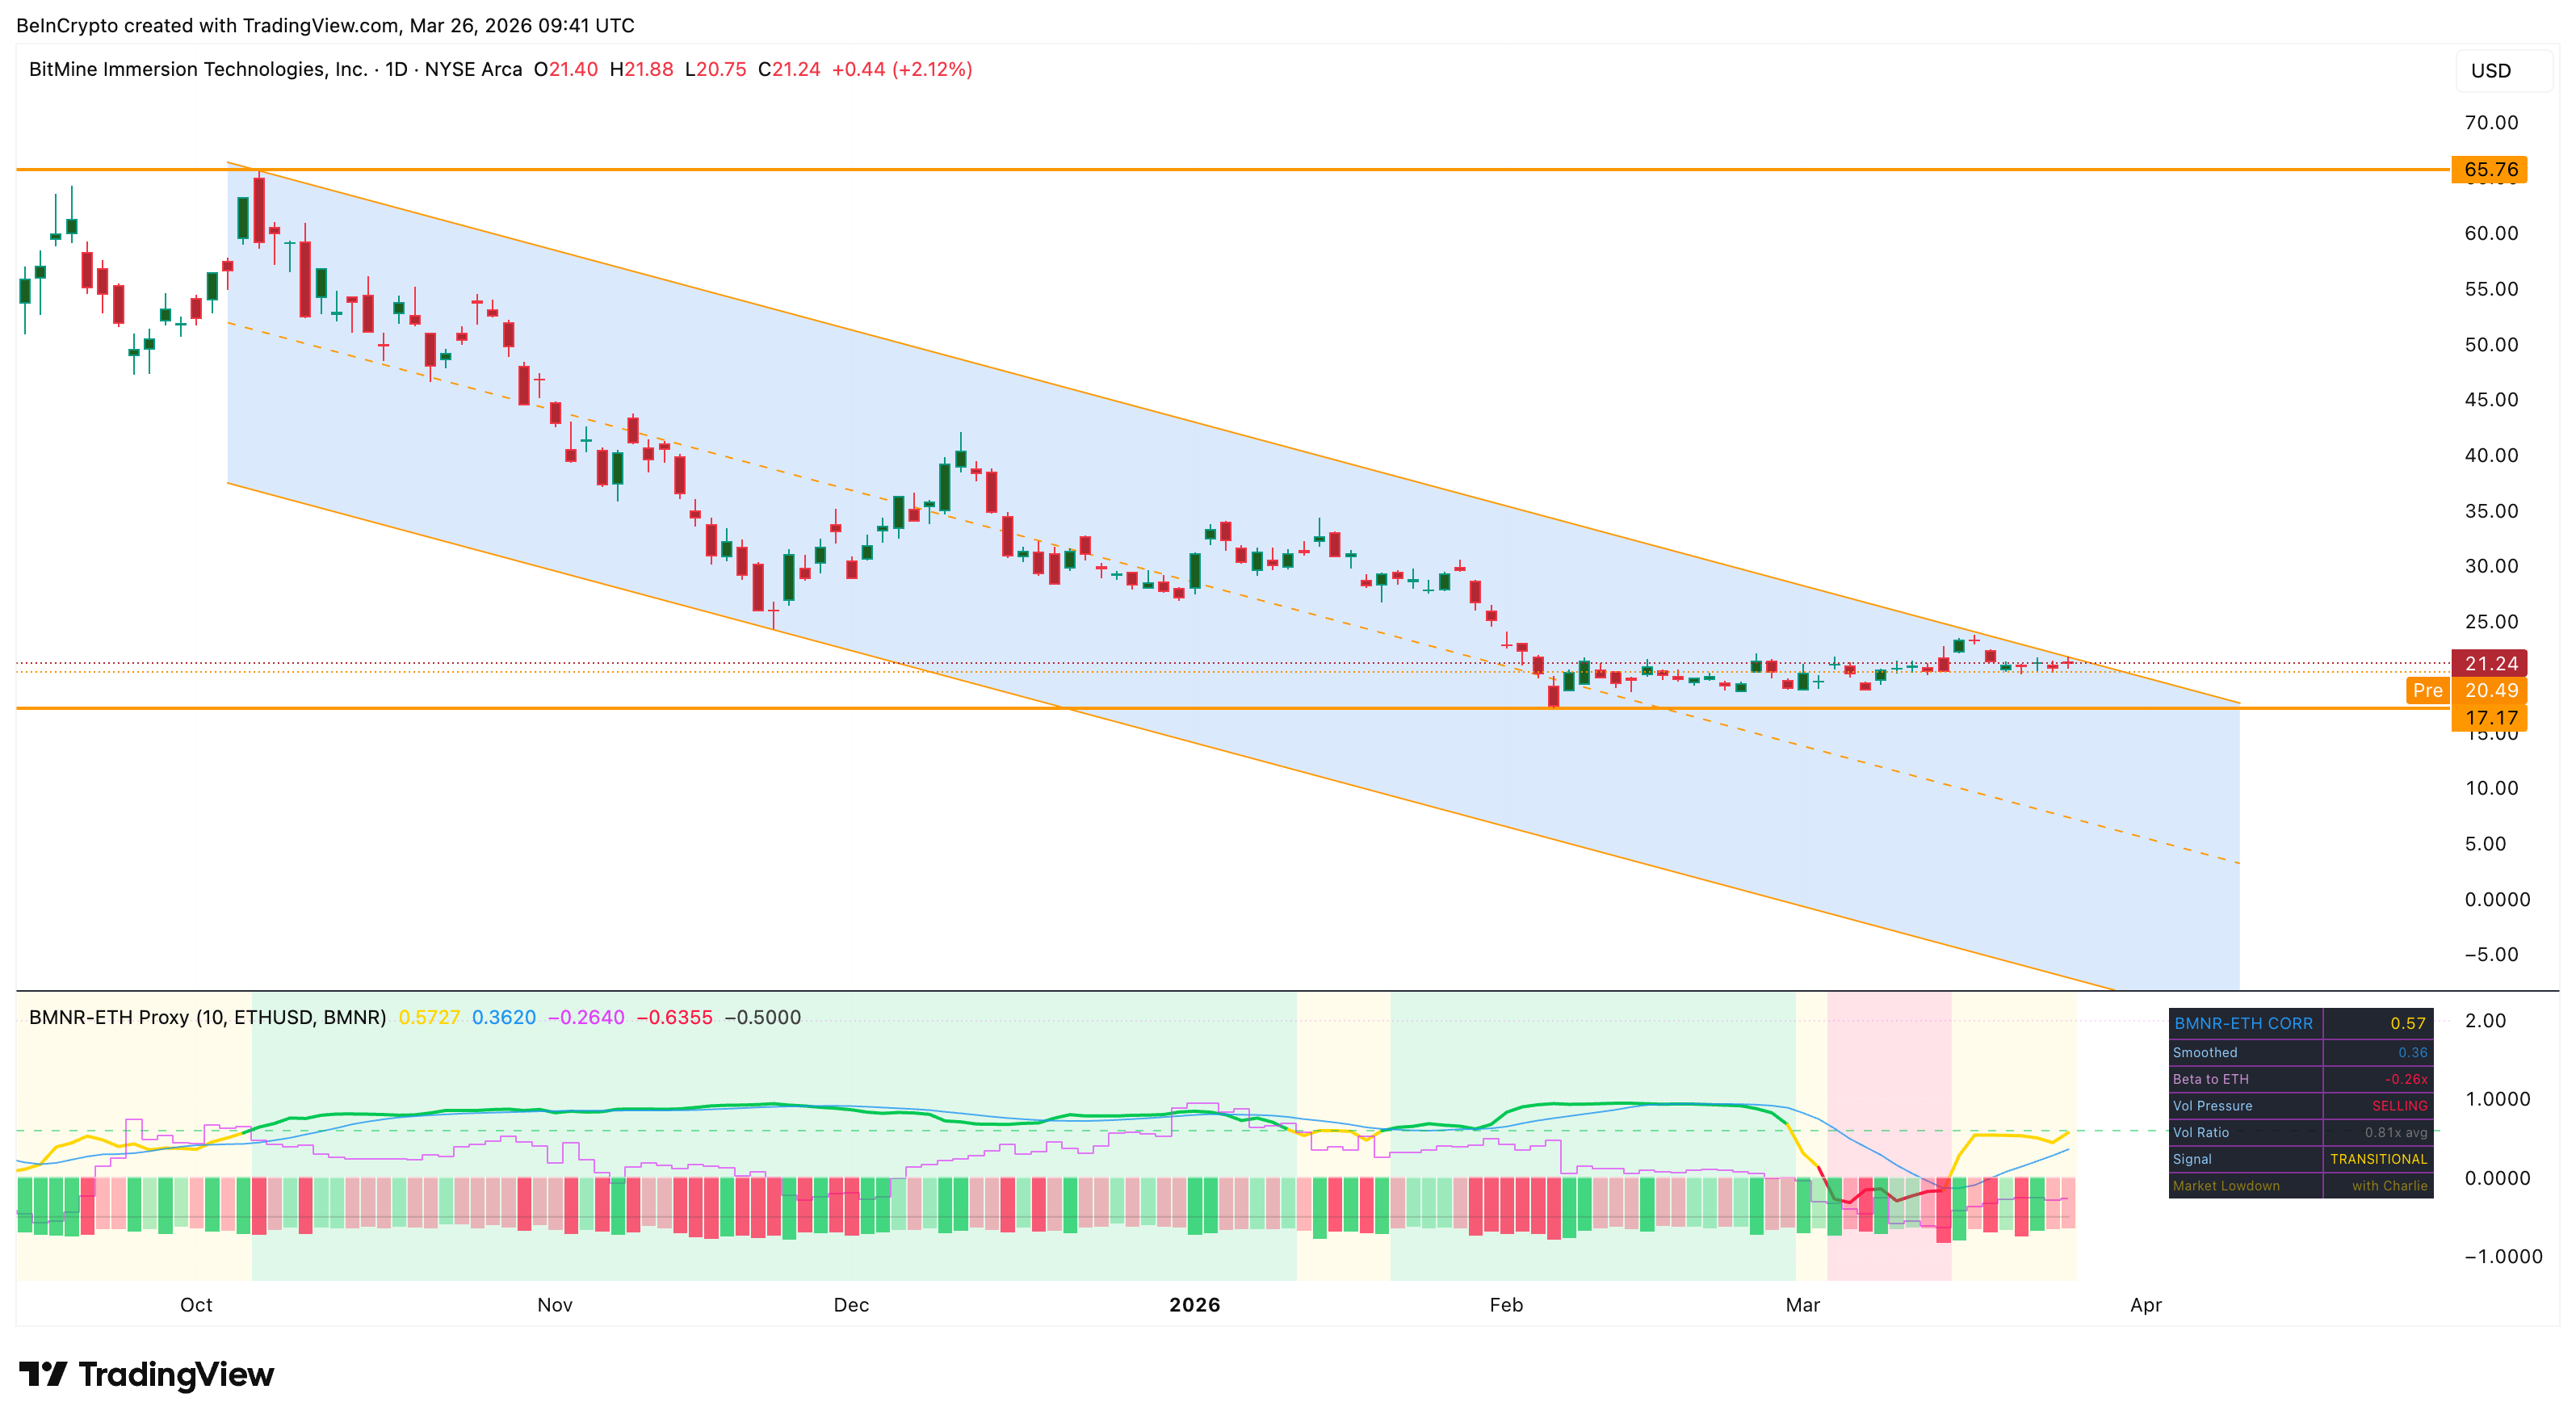 BMNR-ETH Proxy Correlation: TradingView
BitMine continues to buy ETH aggressively. The company’s latest transaction on March 23 added 65,341 ETH to its treasury, bringing total holdings to 4,660,903 ETH. Weekly purchases have accelerated from roughly 35,000 ETH per week in late January to over 65,000 ETH per week by late March. Yet the stock price has not responded positively, more so when ETH remains up month-on-month.
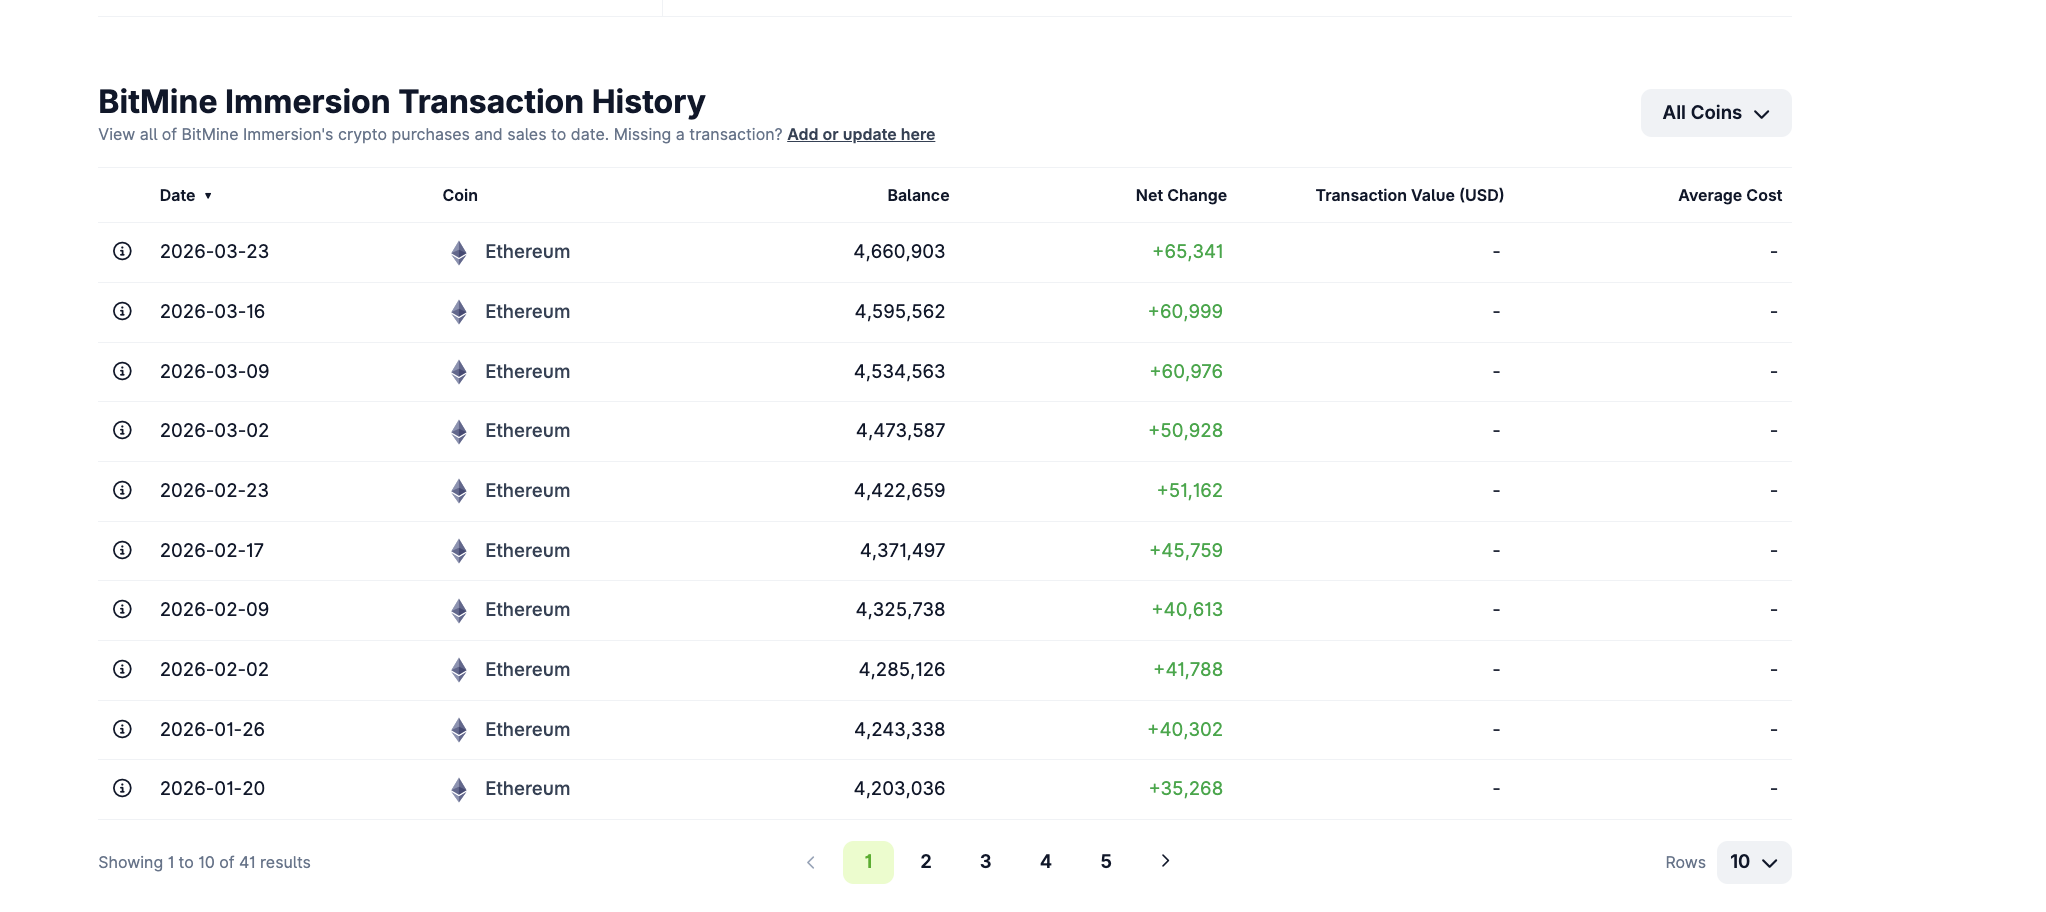 BitMine ETH Transaction History: CoinGecko
The purchases alone are not enough. Institutional money flowing into the stock itself tells a different story.
Institutional Flow Failed to Sustain, Capping Each Rally
Chaikin Money Flow (CMF), a proxy for institutional buying and selling pressure, sits at -0.11 on the daily chart. That negative reading means institutional capital is flowing out of BMNR rather than in, even as the company adds ETH to its balance sheet every week.
CMF briefly moved above the zero line in early March, coinciding with a short rally. However, between March 6 and March 16, prices trended higher while CMF trended lower, forming a bearish divergence. That divergence resolved to the downside. Prices corrected back toward $20, and CMF fell below zero again.
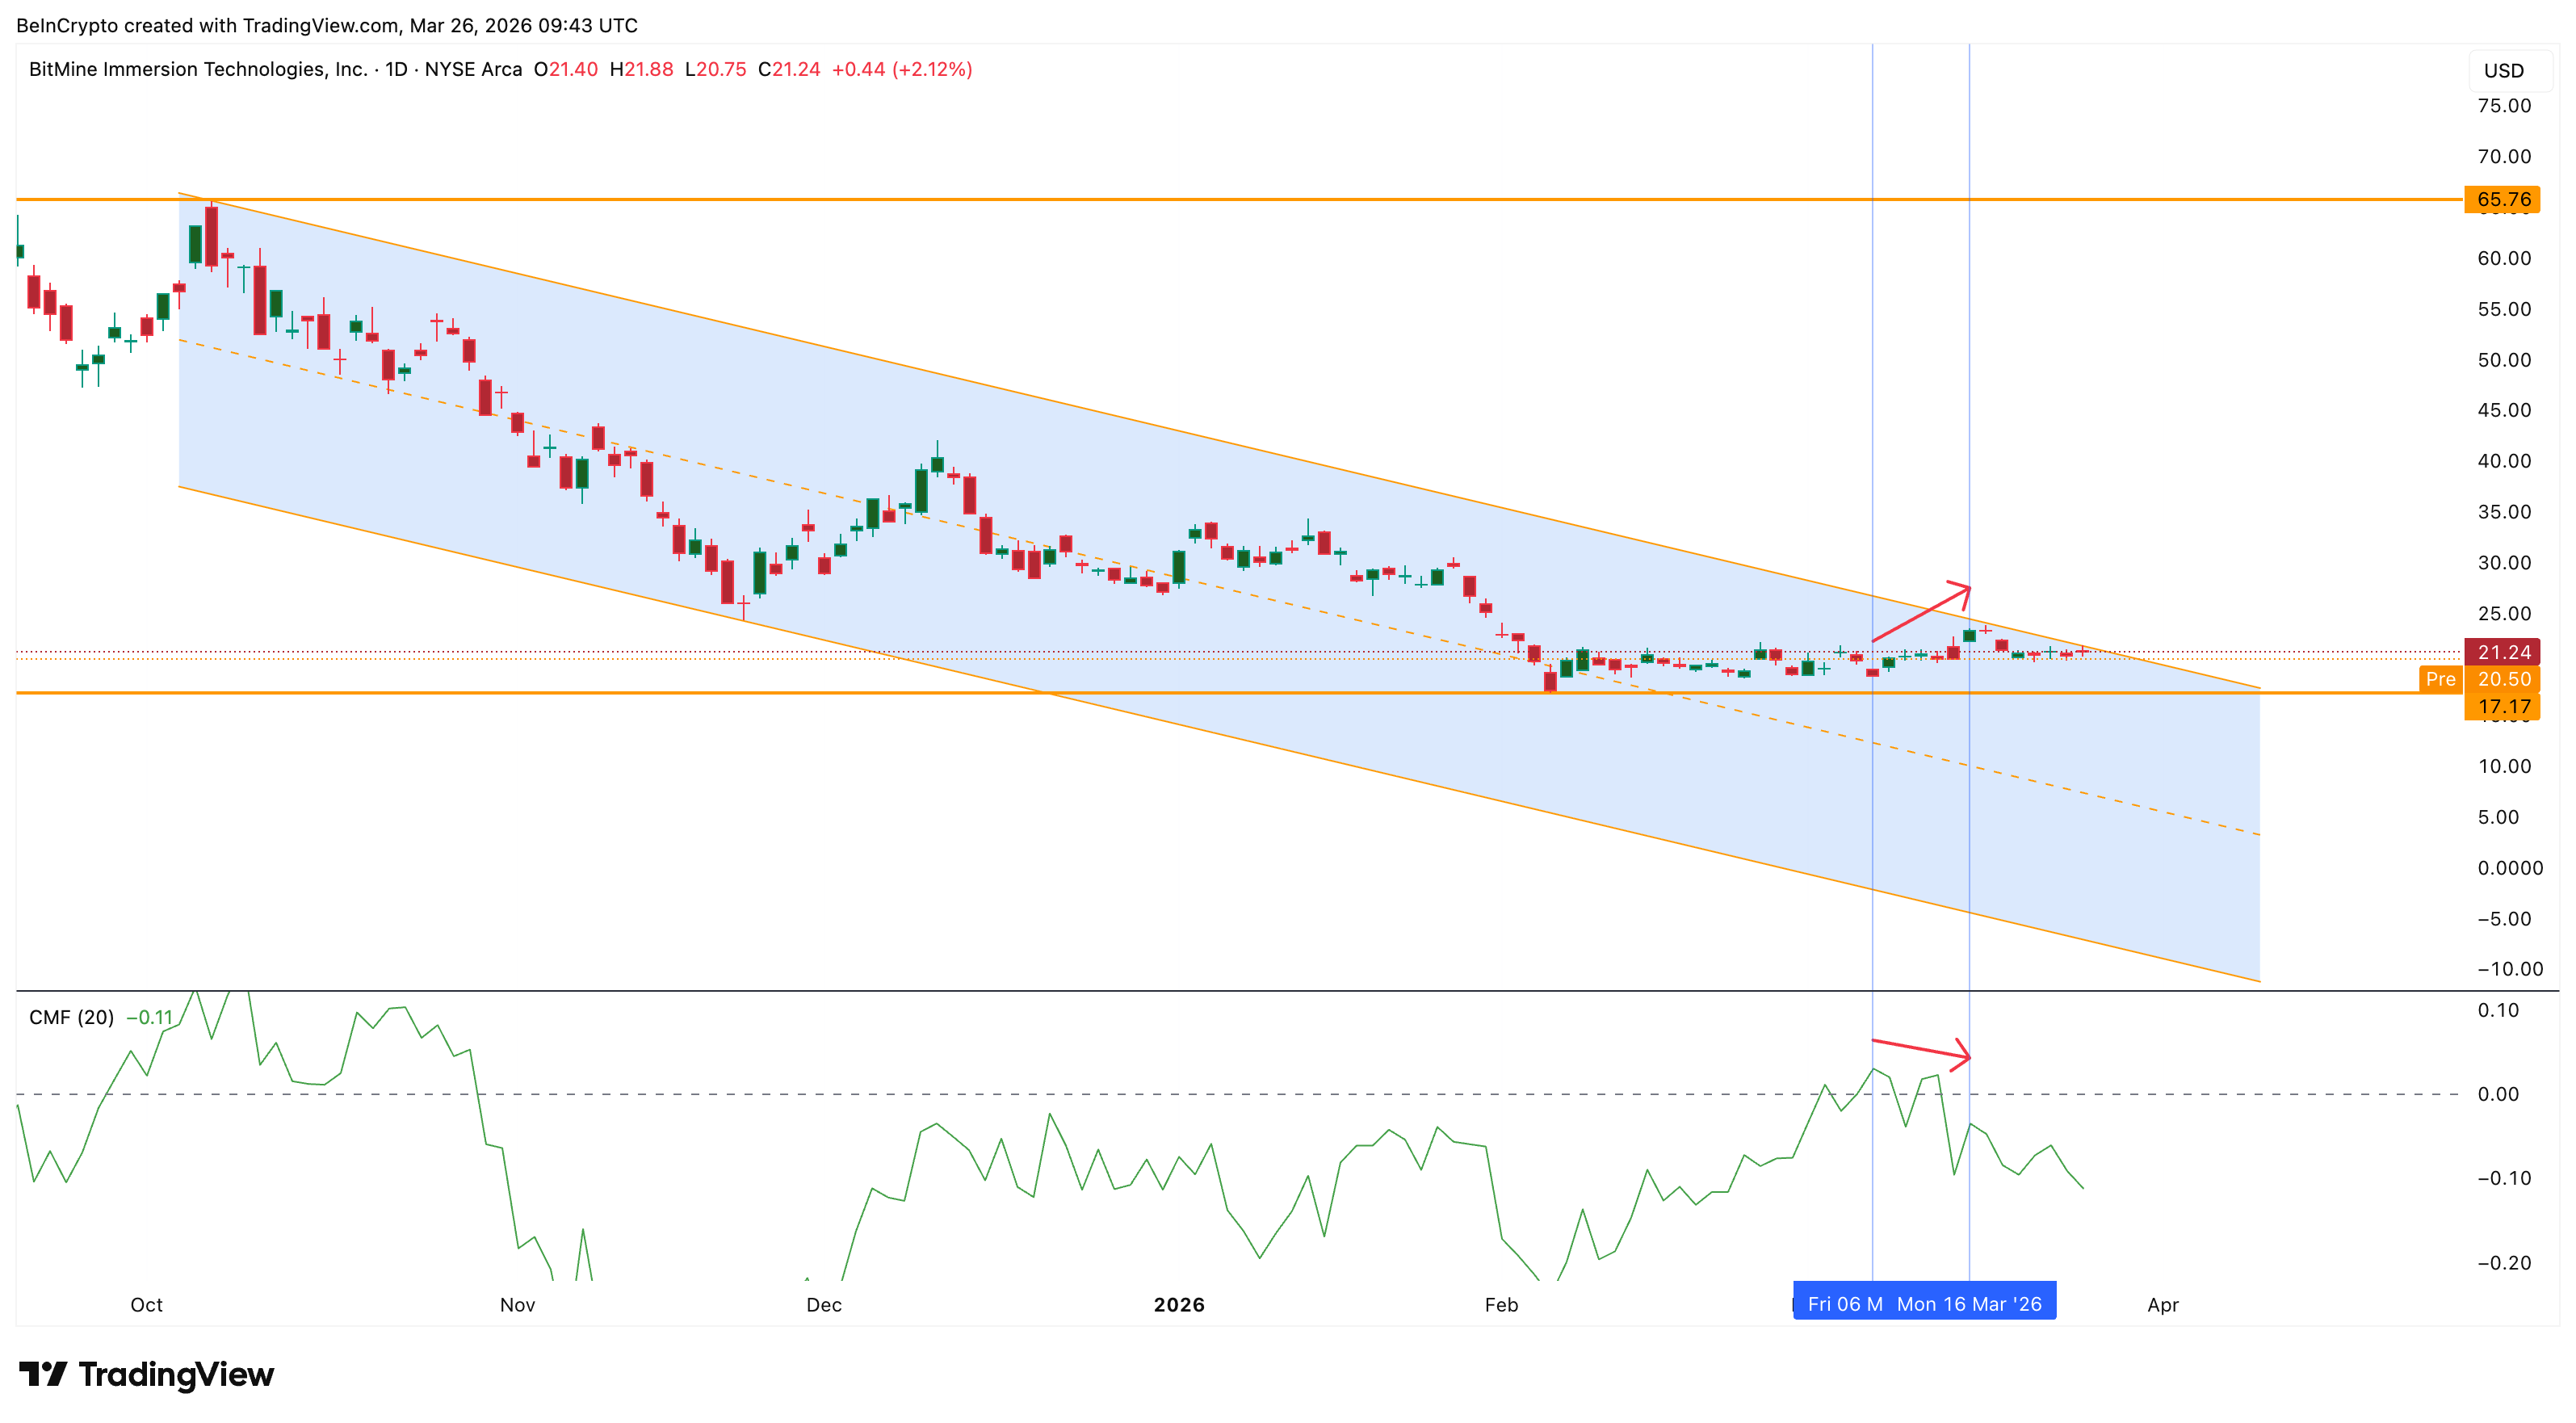 CMF Bearish Divergence: TradingView
The pattern is clear. Without sustained institutional buying pressure above zero, every rally attempt gets sold into. ETH’s upside is not translating into BMNR inflows because the institutional participants who move stock prices are not participating.
If institutions are absent, the question becomes whether any buyer segment is providing support. The RSI offers a possible answer.
BitMine Stock Price Levels Hinge on $23.84 Channel Break
While CMF shows institutional weakness, the Relative Strength Index (RSI), a momentum oscillator, is telling a different story. Between December 31 and March 20, the BitMine stock price made a lower low. During the same period, RSI made a higher low, forming a standard bullish divergence.
This divergence suggests that selling momentum is weakening at the lows. The buyers providing that floor may be retail participants or smaller funds accumulating at discounted levels, given that institutional flow via CMF remains negative. RSI currently reads 48.91, approaching the neutral 50 line from below.
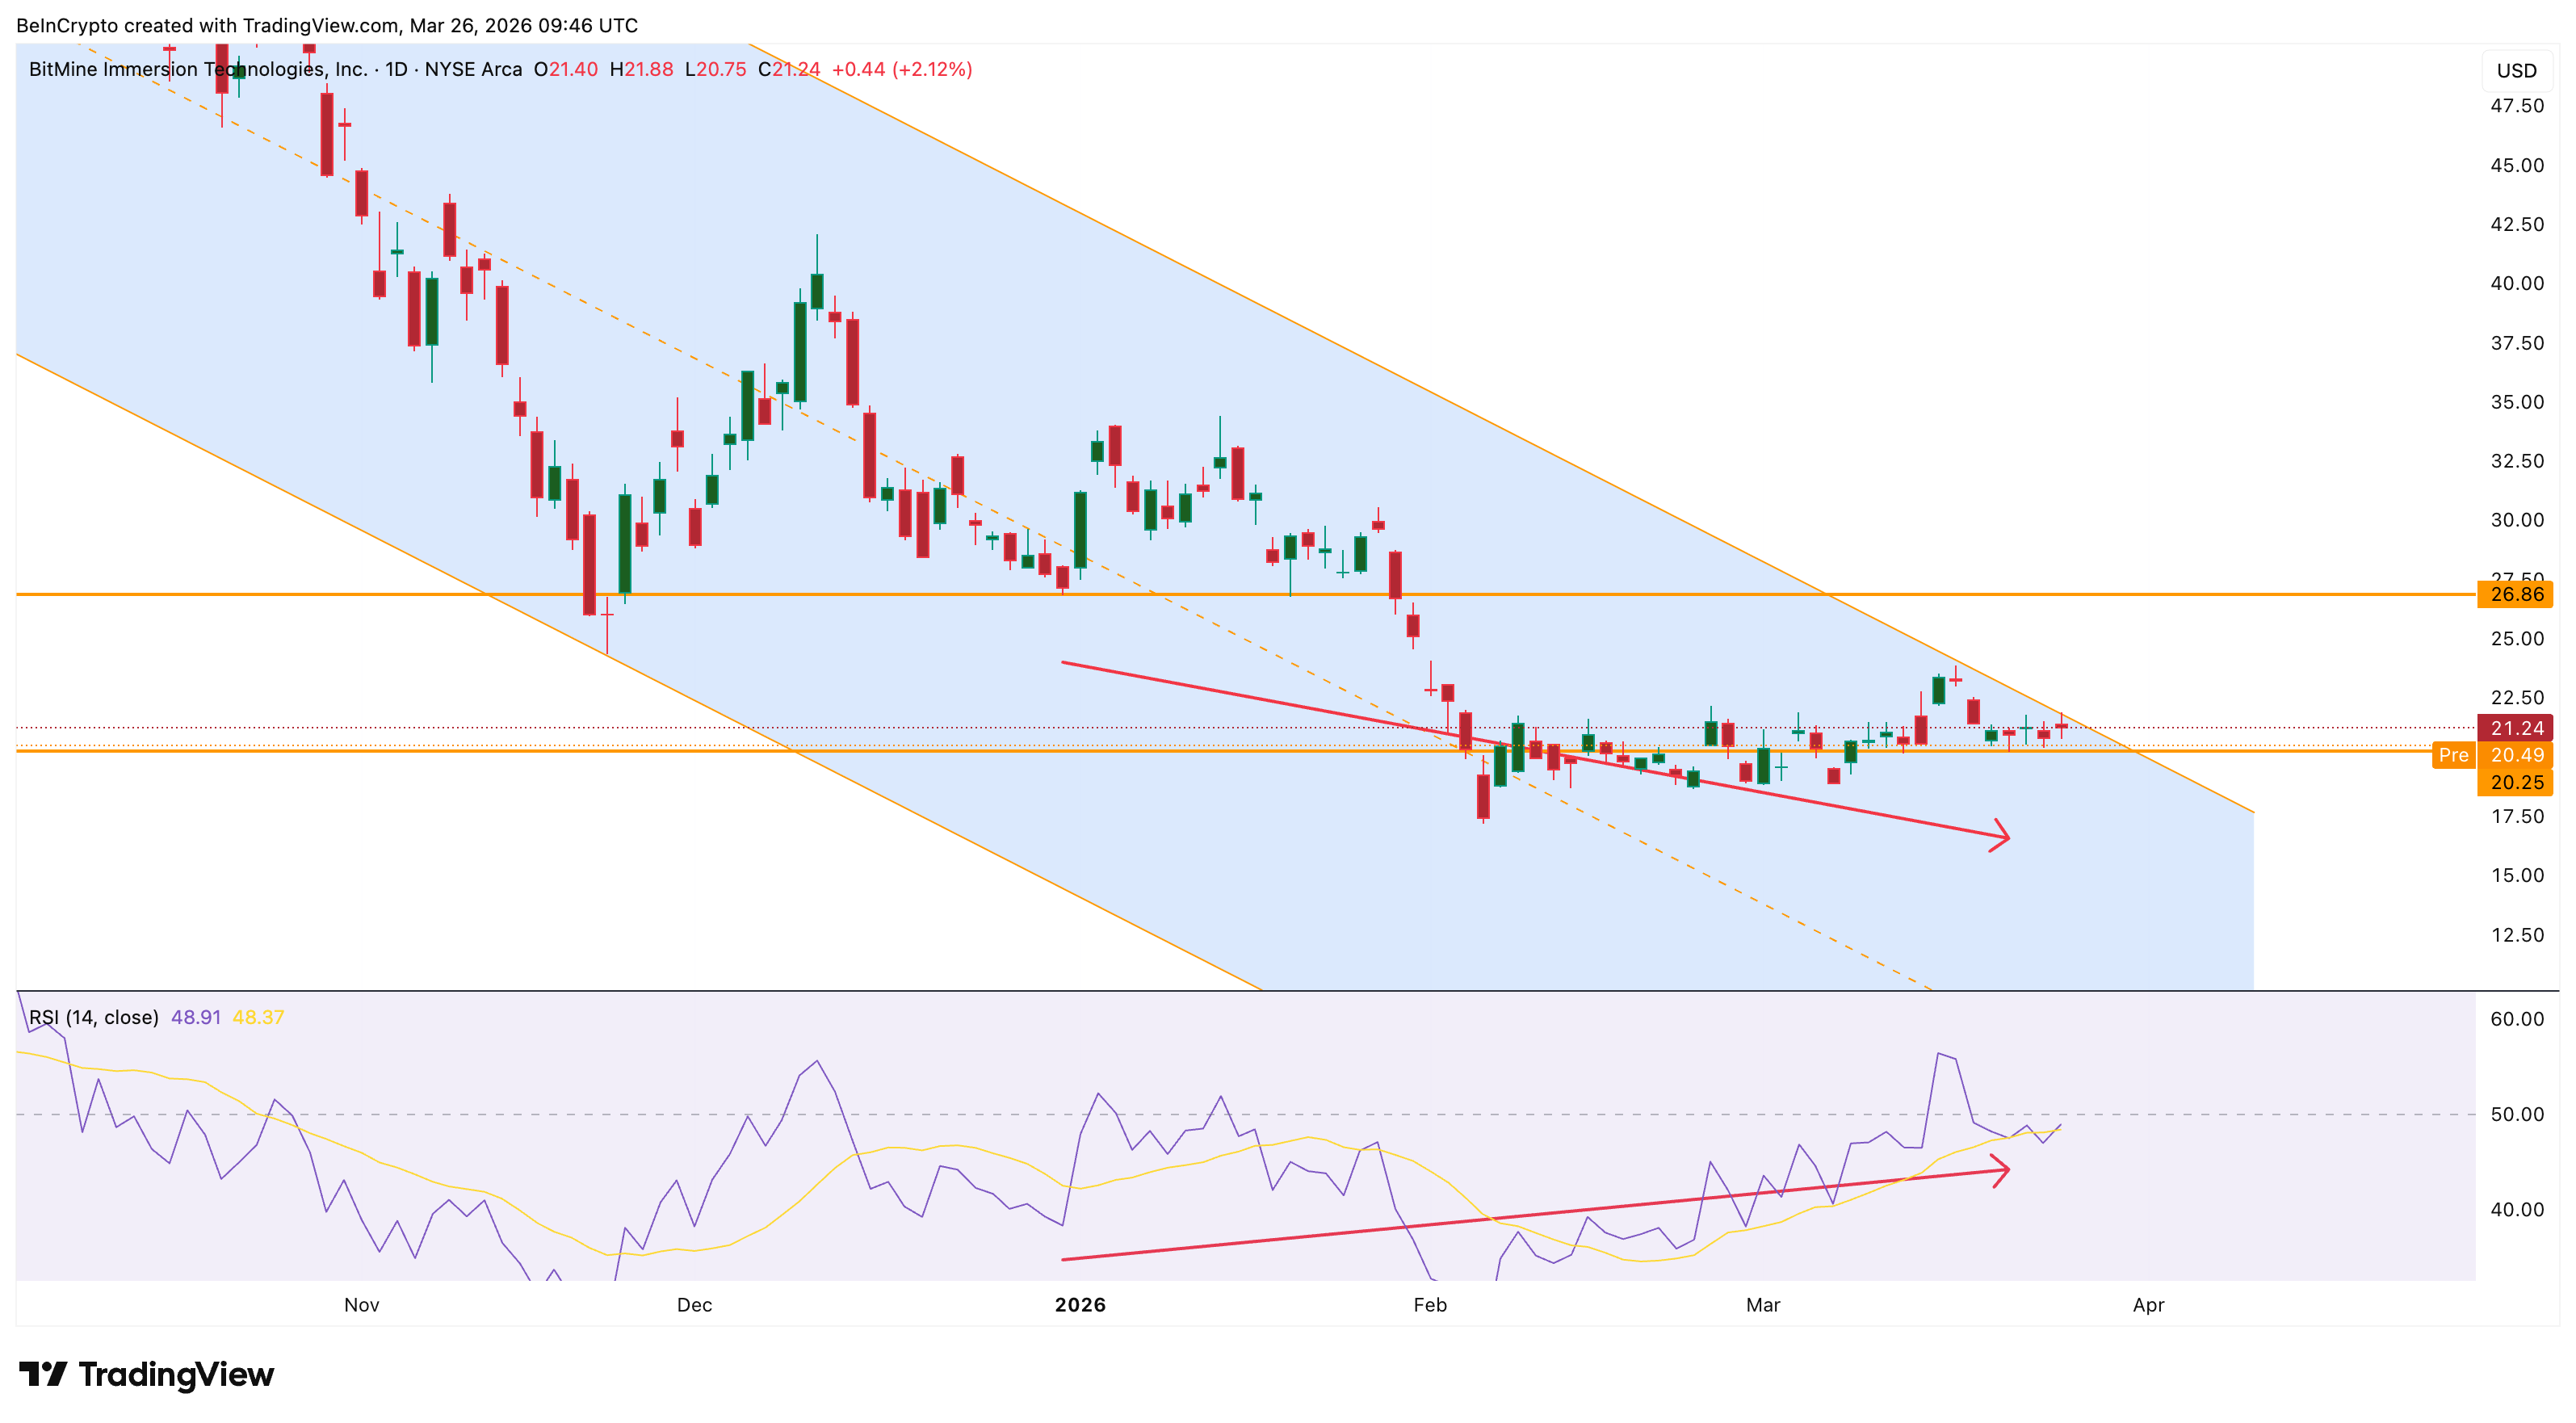 RSI Bullish Divergence: TradingView
However, the RSI signal faces a structural ceiling. The falling channel’s upper trendline and a key technical level converge at $23.84. A daily close above that level would confirm the channel breakout and potentially attract the institutional flow that has been absent for months. The move from the current price to $23.84 requires an 11% rally.
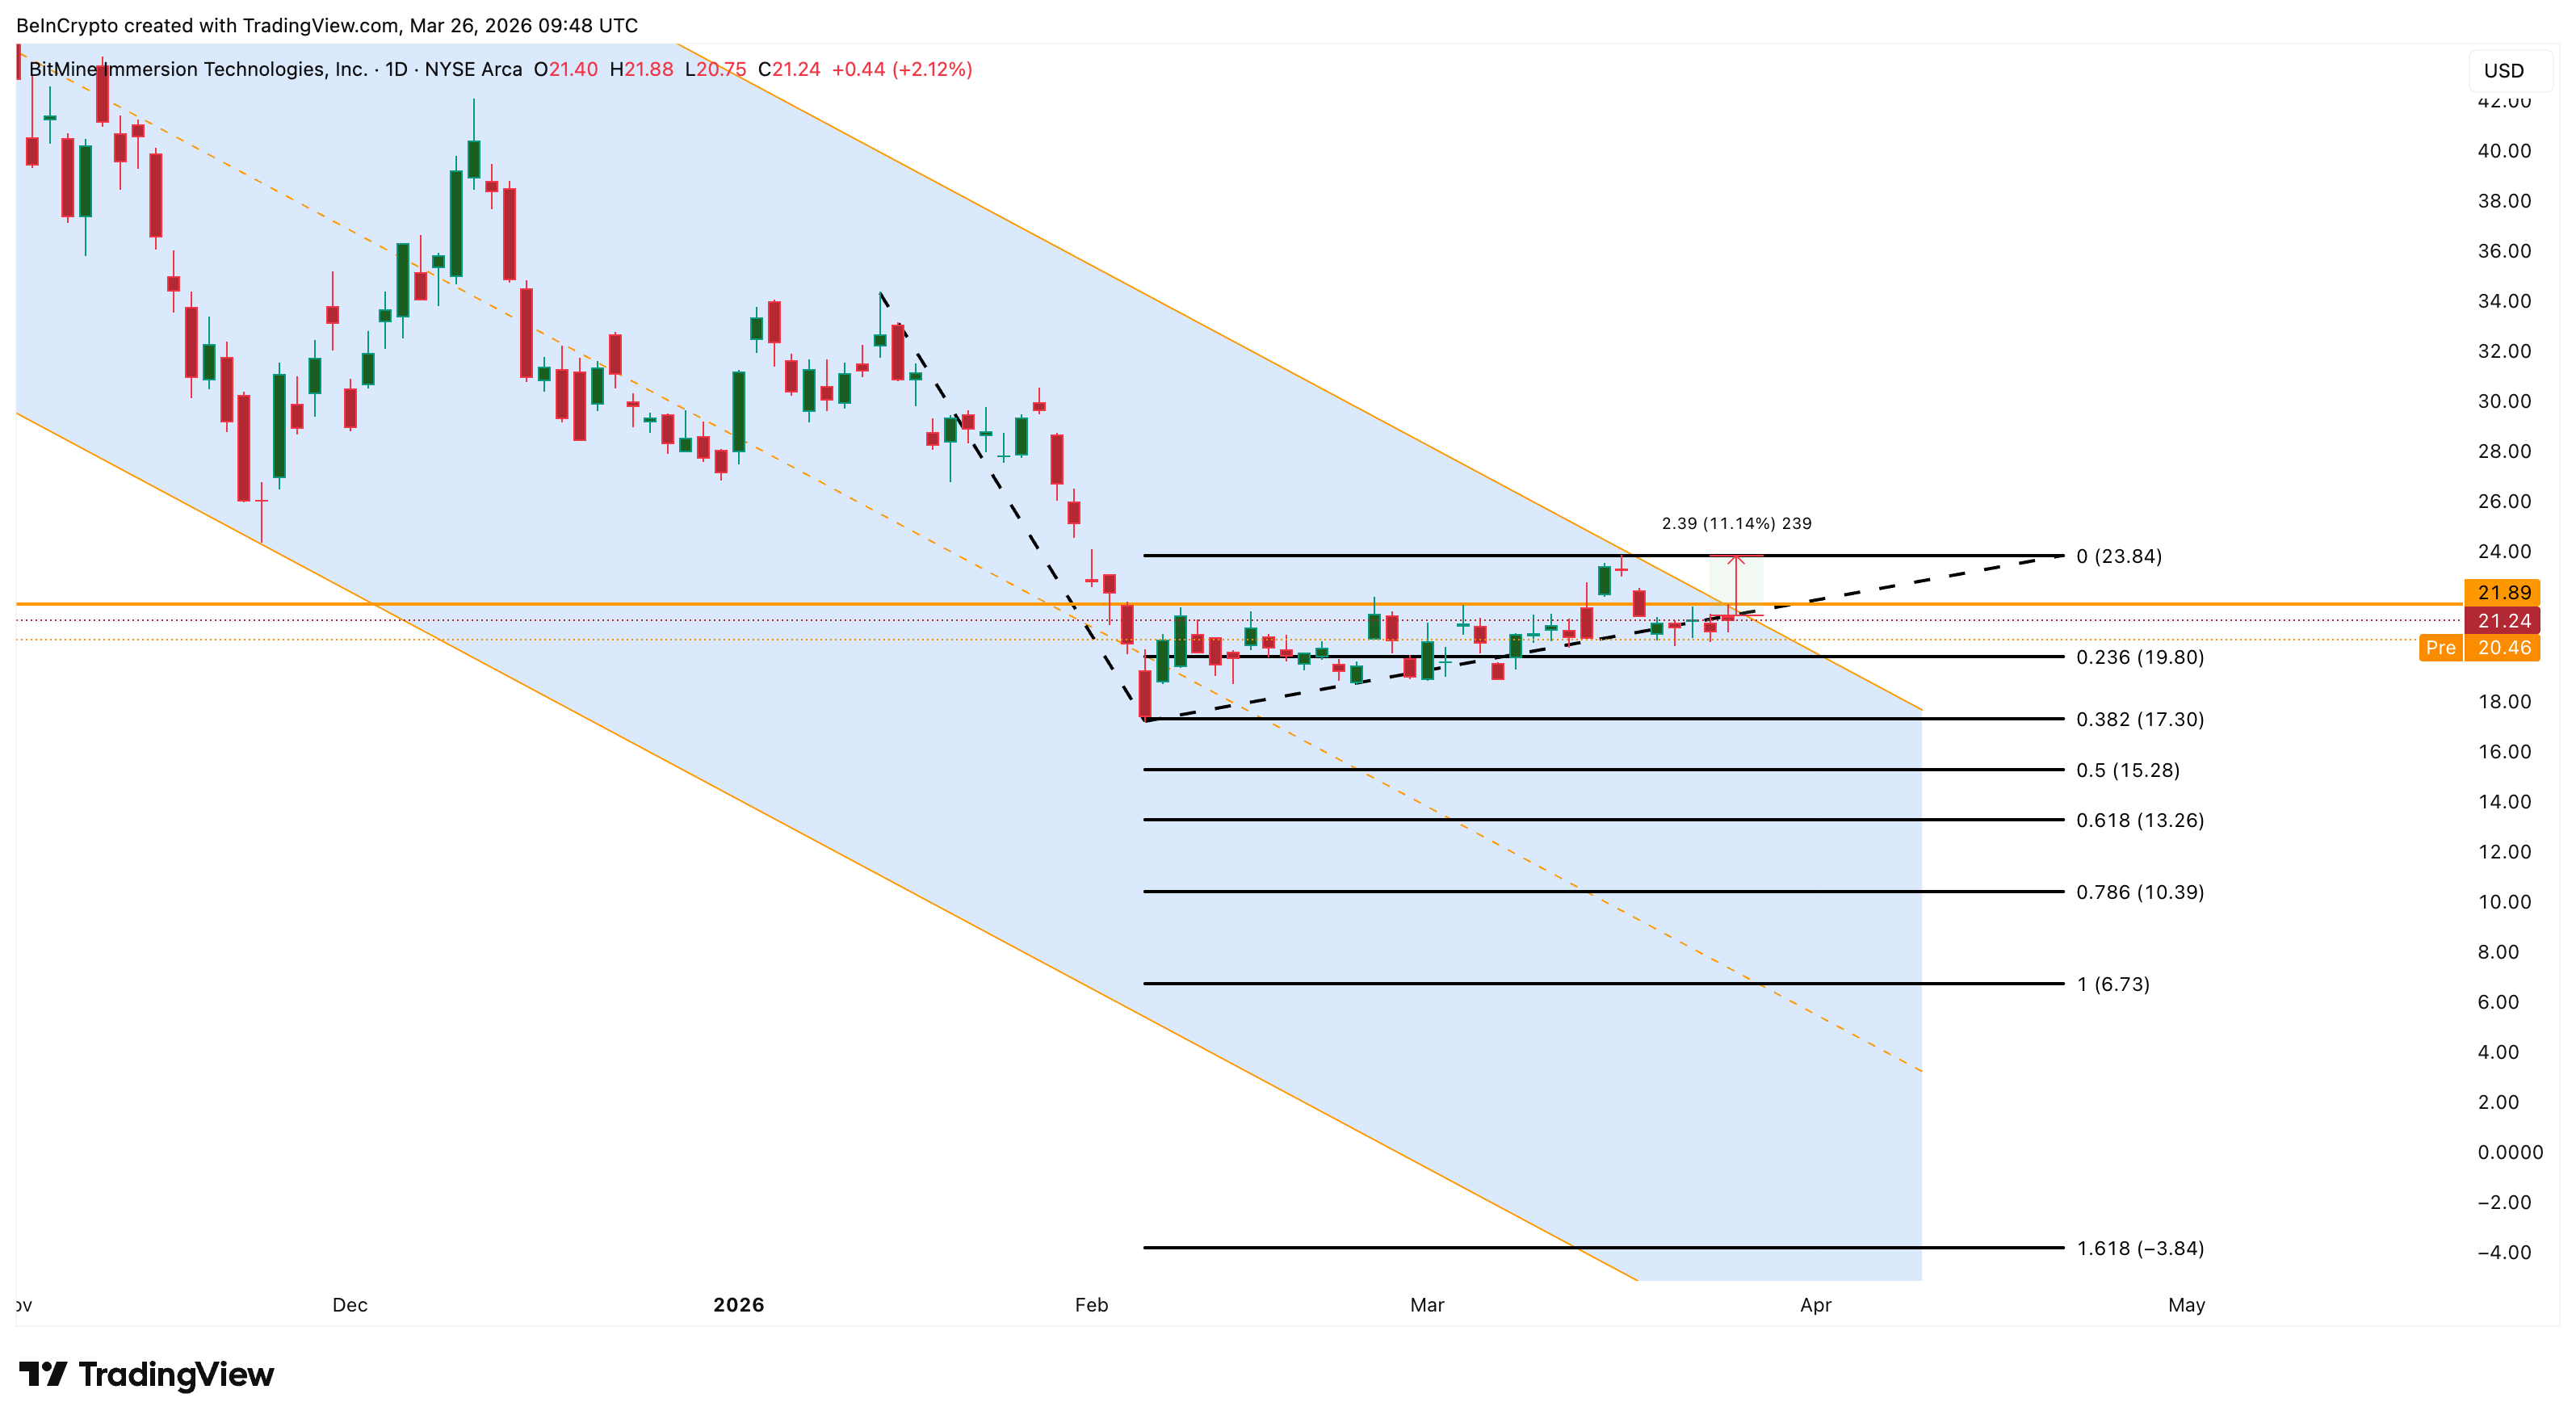 BMNR Price Analysis: TradingView
Before $23.84, the interim structural resistance sits at $21.89. On the downside, $19.80 is the first support. A close below that level could expose $17.30, where the channel low sits. If institutional outflows continue, even $15.28 and $13.26 become possible targets.
A daily close above $23.84 would break the six-month channel and potentially realign the BitMine stock price with Ethereum’s rally, while a failure below $19.80 confirms that even a 4.66 million ETH treasury cannot rescue a stock that institutions refuse to buy.
Recommended Articles


