

Why Long-Term Solana Holders Were Not Ready for This 9% Price Pullback
Solana price dropped around 9% over the past three days after a pullback signal flashed on the daily chart. The same signal earlier in March led to a deeper 14% correction. But this time, something changed.
Solana holders didn’t look ready for this drop, something they were reactive to during the previous pullback. More importantly, they did not react the same way. That raises a key question. Are they seeing something else?
Bearish Divergence Triggers Pullback Below Key Levels
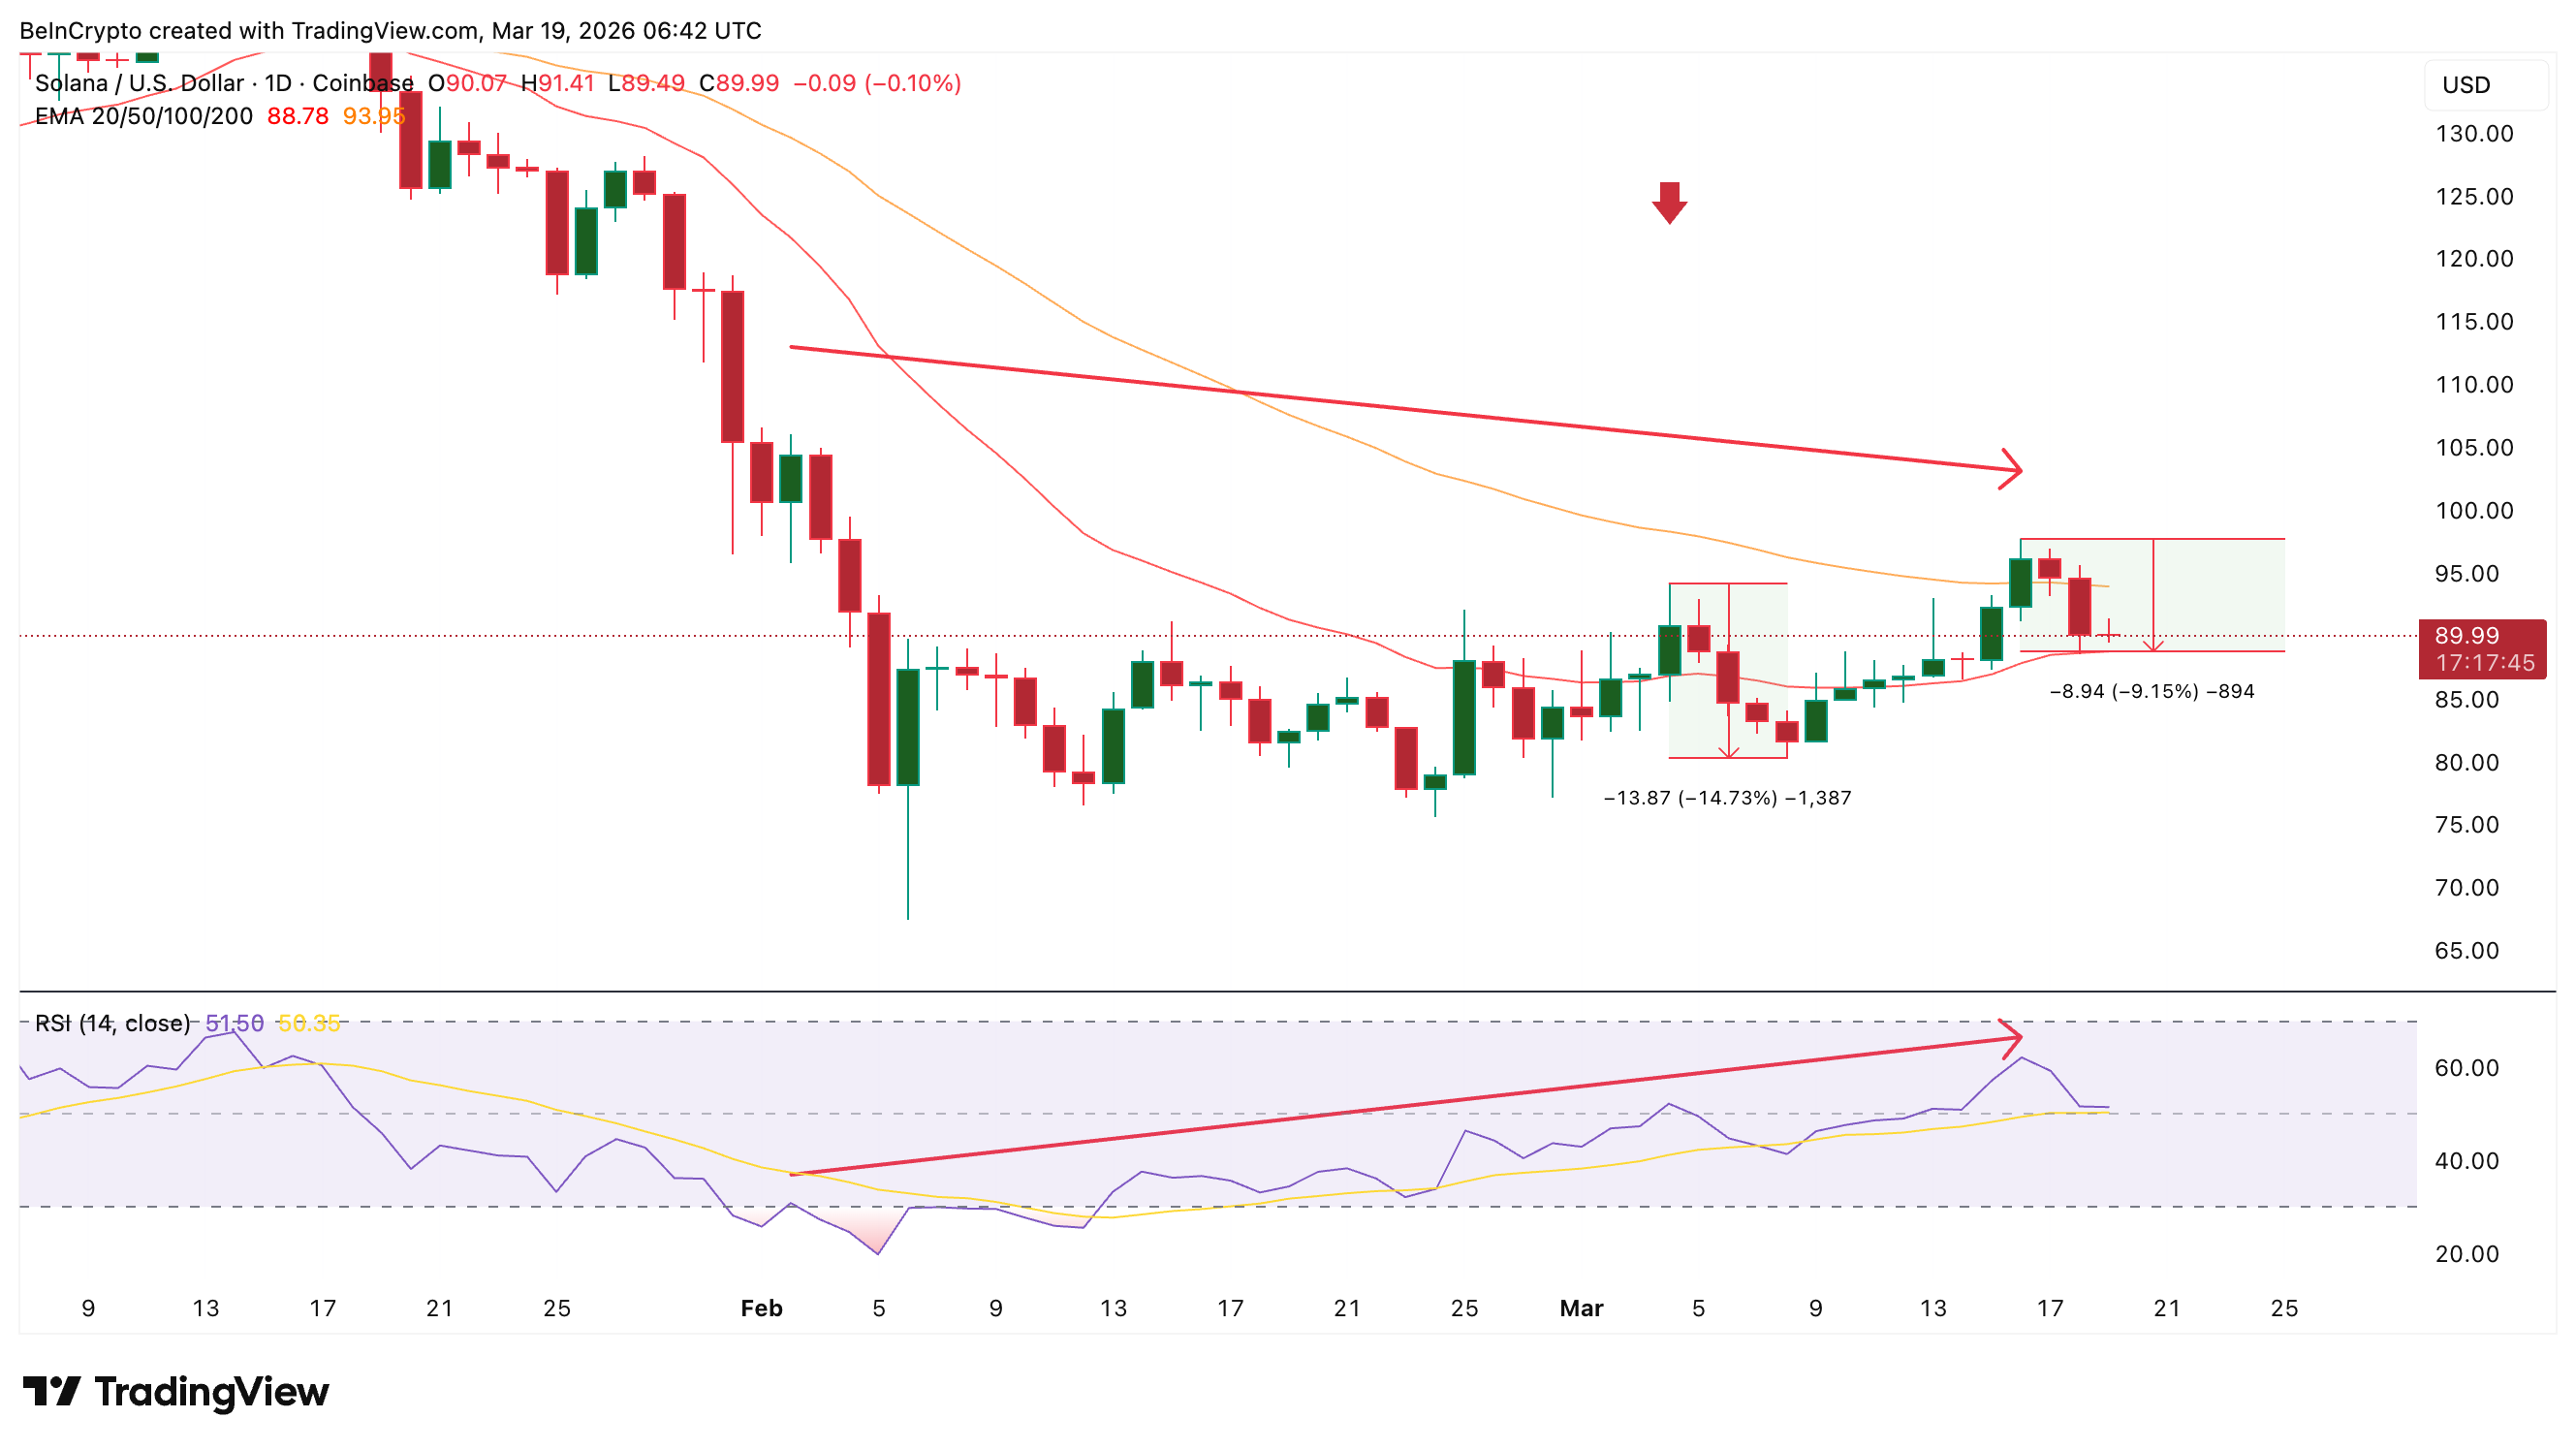
Solana flashed a hidden bearish divergence between February 2 and March 16.
During this period, price formed a lower high, while the Relative Strength Index (RSI), a momentum indicator that tracks buying and selling strength, formed a higher high: a hidden bearish divergence. This setup usually signals a pullback. It shows momentum is rising, but the price is failing to follow.
A similar signal appeared between February 2 and March 4. That move led to a sharp drop of nearly 14.7%.
This time, the pattern repeated. Solana dropped around 9.15% after March 16.
Want more token insights like this? Sign up for Editor Harsh Notariya’s Daily Crypto Newsletter here.
 RSI Divergence And Pullback: TradingView
At the same time, price lost the 50-day Exponential Moving Average (EMA), which is a trend line that gives more weight to recent prices and helps track short-term direction. This level sat near $93 and acted as support. Losing it signaled weakness. However, the drop slowed near the 20-day EMA around $88, which is now acting as immediate support, with the price near $89.
So the signal worked again. But the holder reaction behind the move did not.
Solana Holders Were Not Ready for This Price Drop
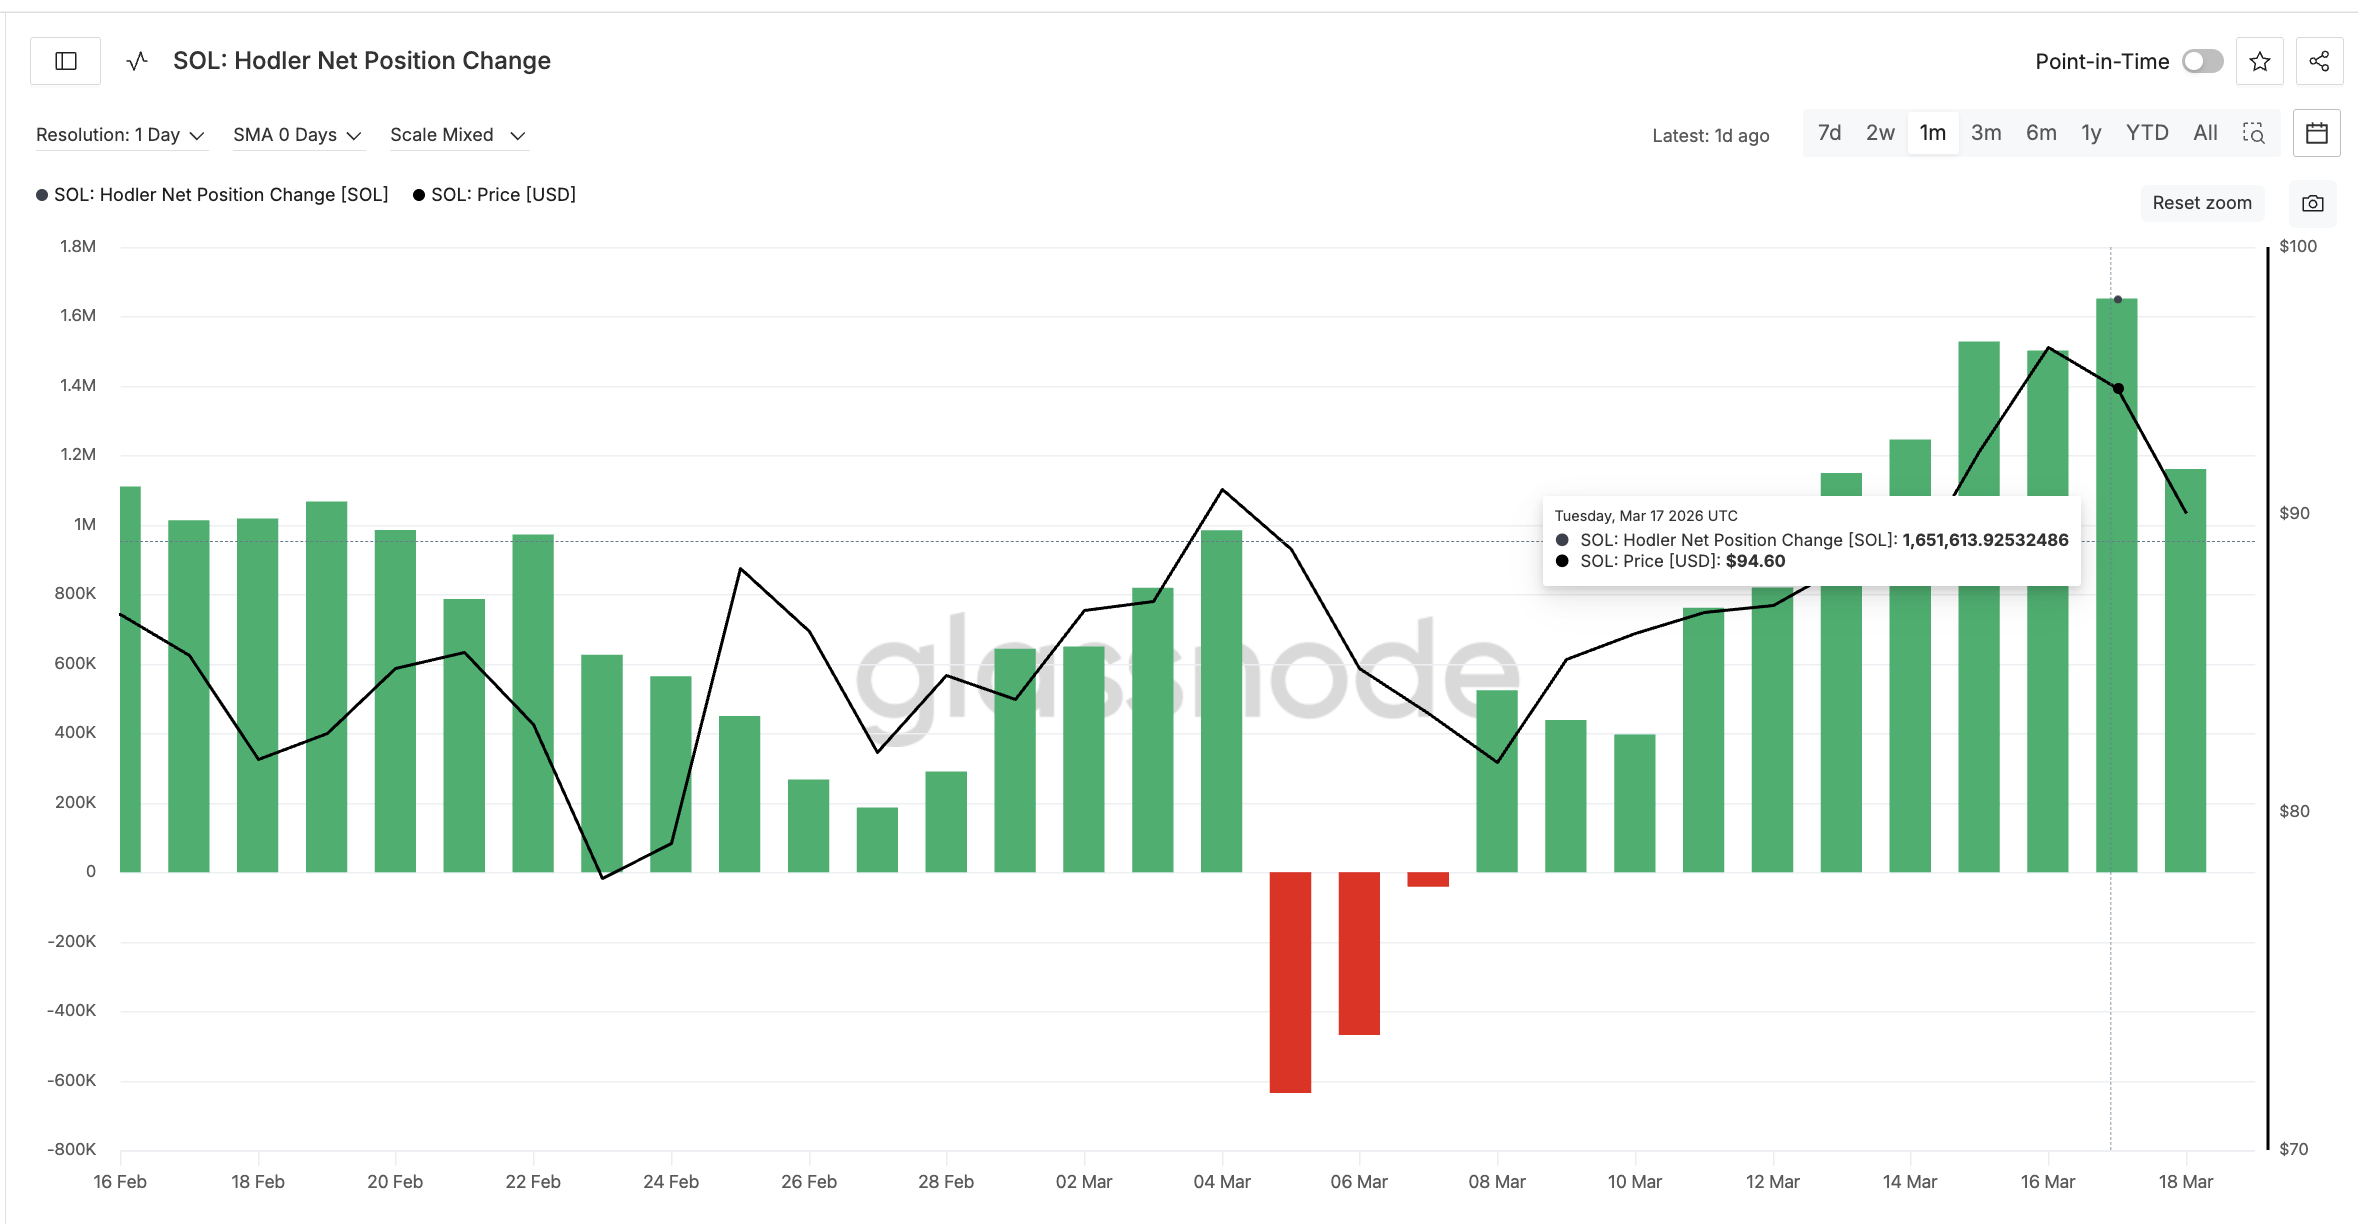
The key difference lies in holder behavior. The Hodler net position change metric, which tracks the wallets holding assets for more than 155 days, reacted very differently this time. These are mid- to long-term Solana holders, and this metric tracks whether they are adding or reducing positions over time.
On March 4, when the same divergence appeared, these holders immediately flipped to wallet outflows (selling) between March 4 and March 5. The drop that followed confirmed the bearish setup.
But on March 16, the reaction flipped.
Instead of selling, holders accumulated. Net position change increased from around 1,501,793 SOL to 1,651,613 SOL. That is an increase of roughly 10%. Even after a slight Solana price dip, the metric remains positive. This shows that holders were not ready for this drop.
 SOL Holders Behaving Differently: Glassnode
Not because they missed the signal, but because they were positioned for something else. That makes this setup different. The signal points to a pullback, but positioning suggests expectation of continuation.
So the next question is clear. What are holders seeing that supports this view?
Solana Price Pattern Shows What Holders Are Positioning For
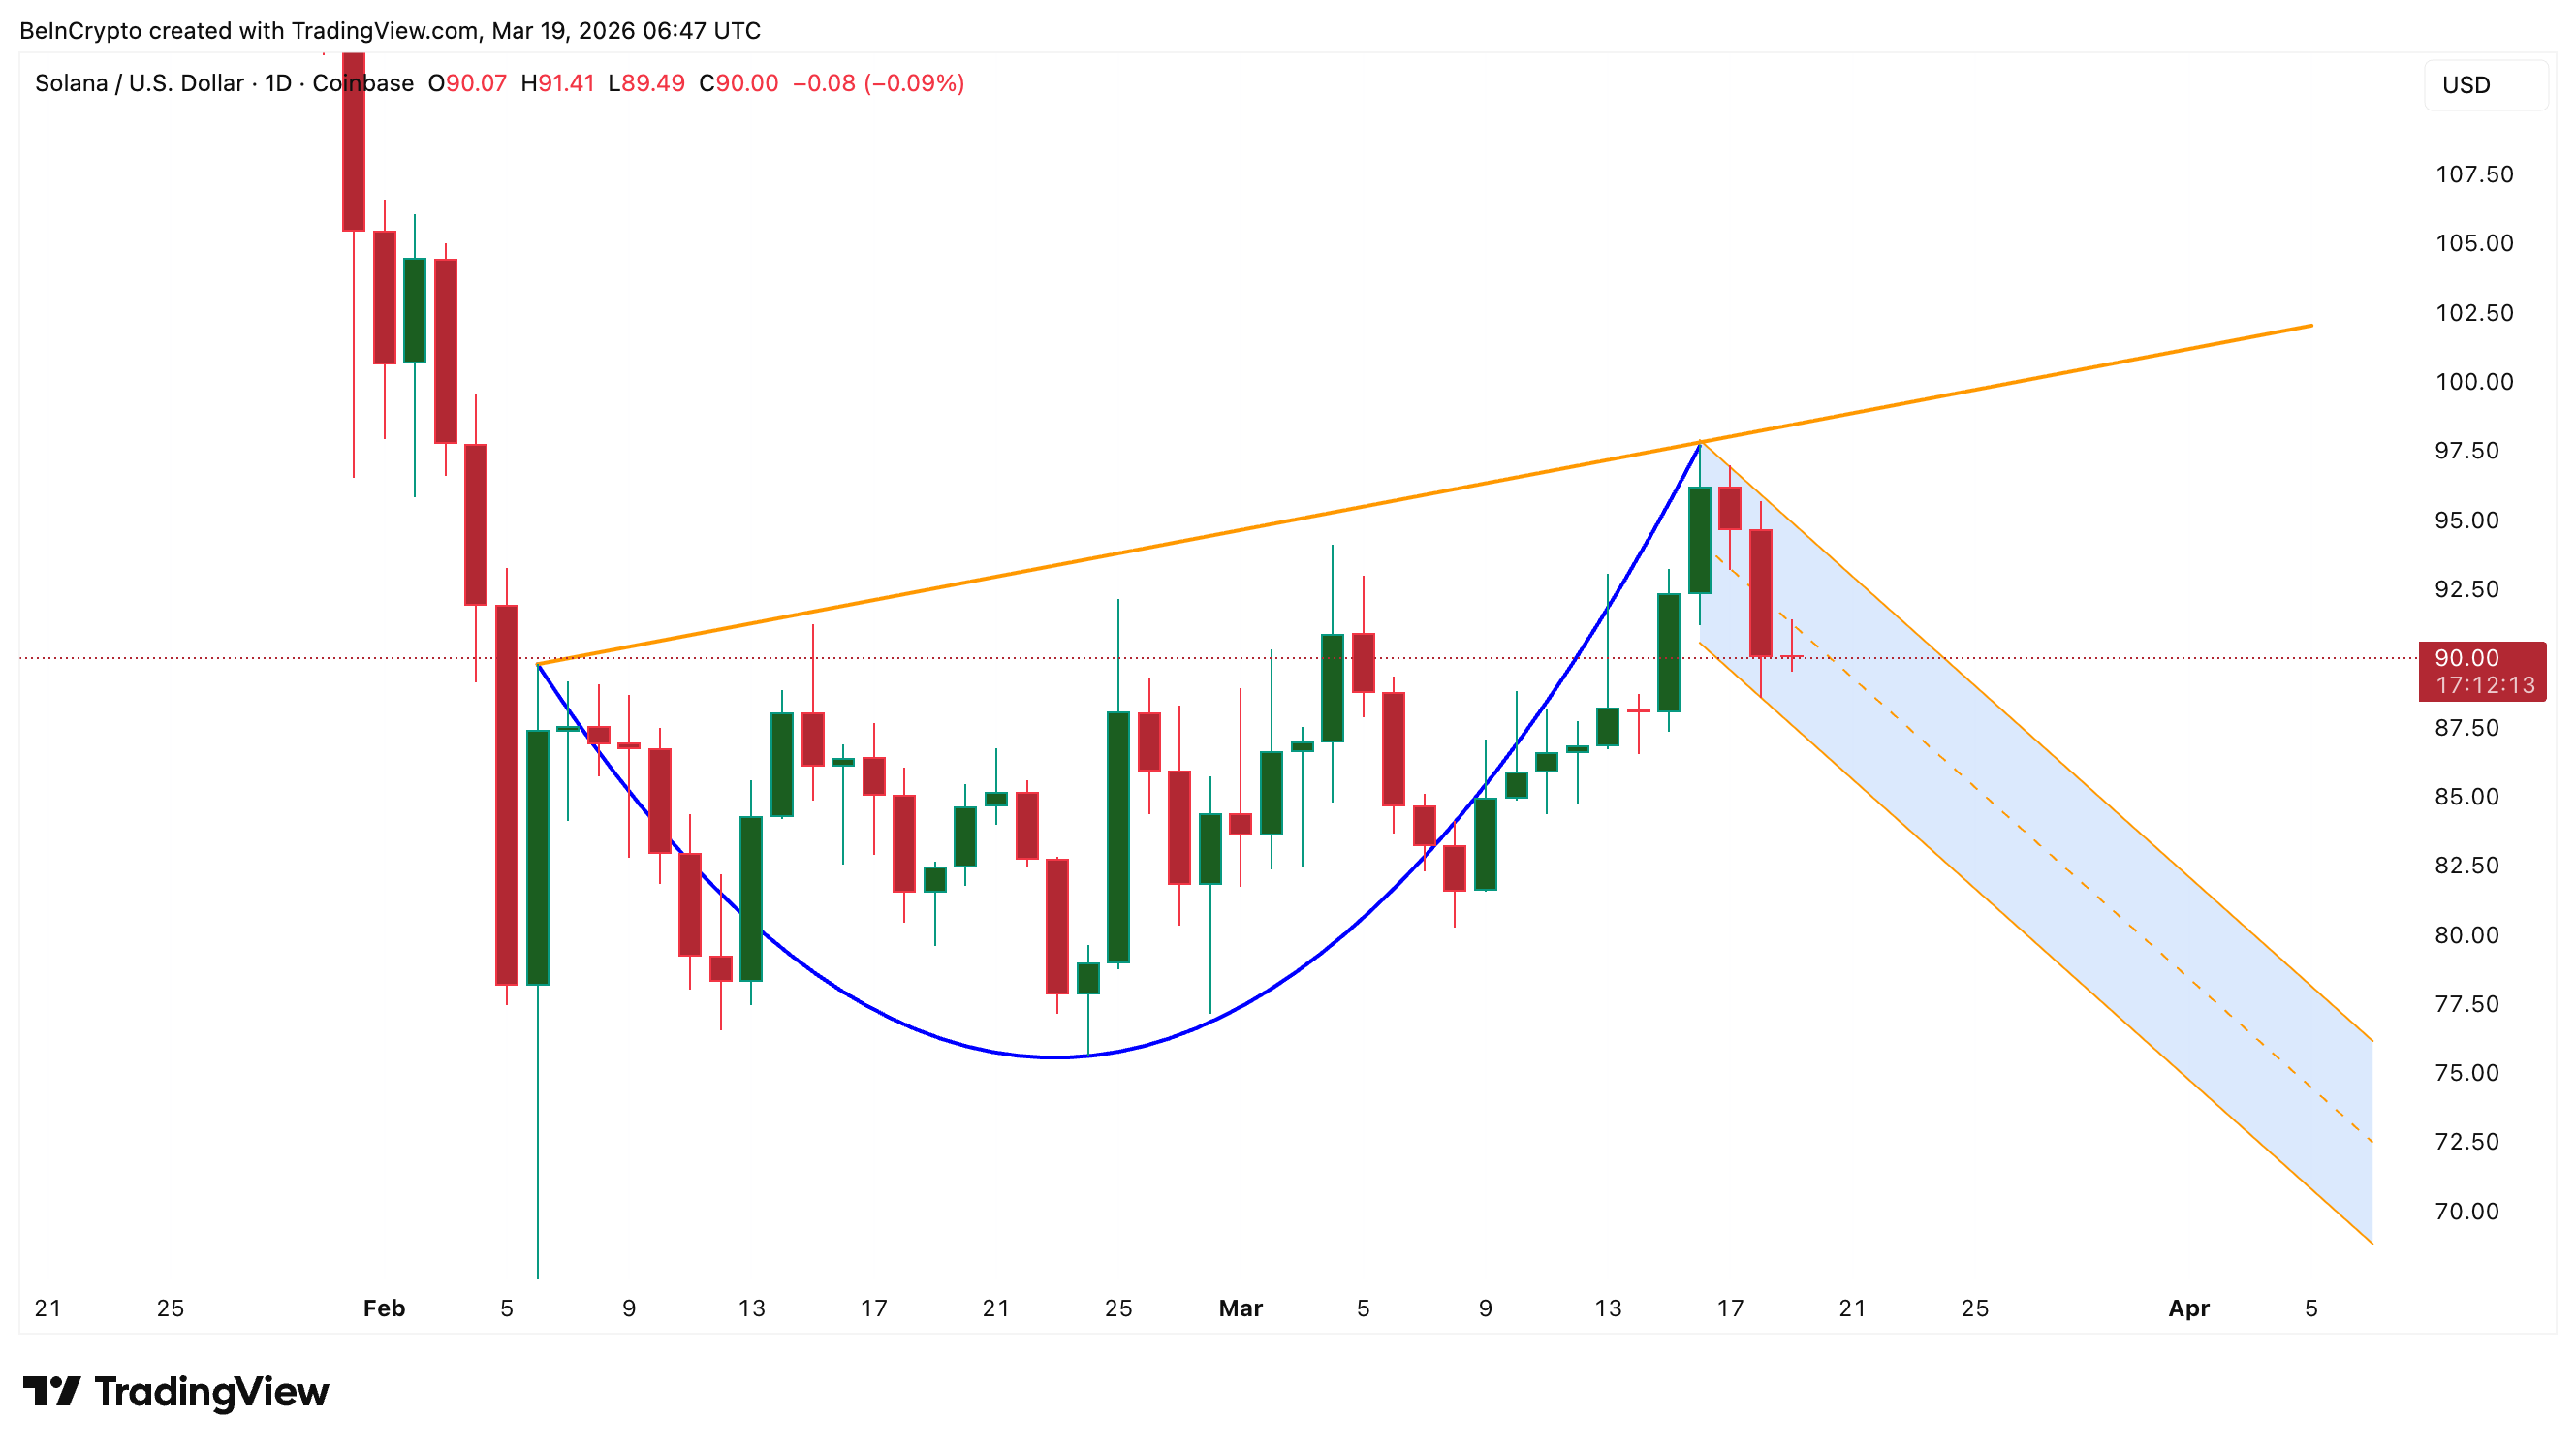
The answer likely lies in the broader structure. From the February 6 swing high to the March 16 high, Solana seems to be forming a cup-and-handle pattern. The current drop fits into the handle phase, which is typically a short consolidation before continuation.
 Price Structure: TradingView
This suggests the 9% decline may not be a breakdown. Instead, it may be part of a larger bullish setup. That is the key difference from early March. Back then, the structure was weaker. This time, it is more defined.
This also explains why holders did not sell. They are likely positioning for the continuation of this pattern. Now, key SOL levels decide whether that view holds.
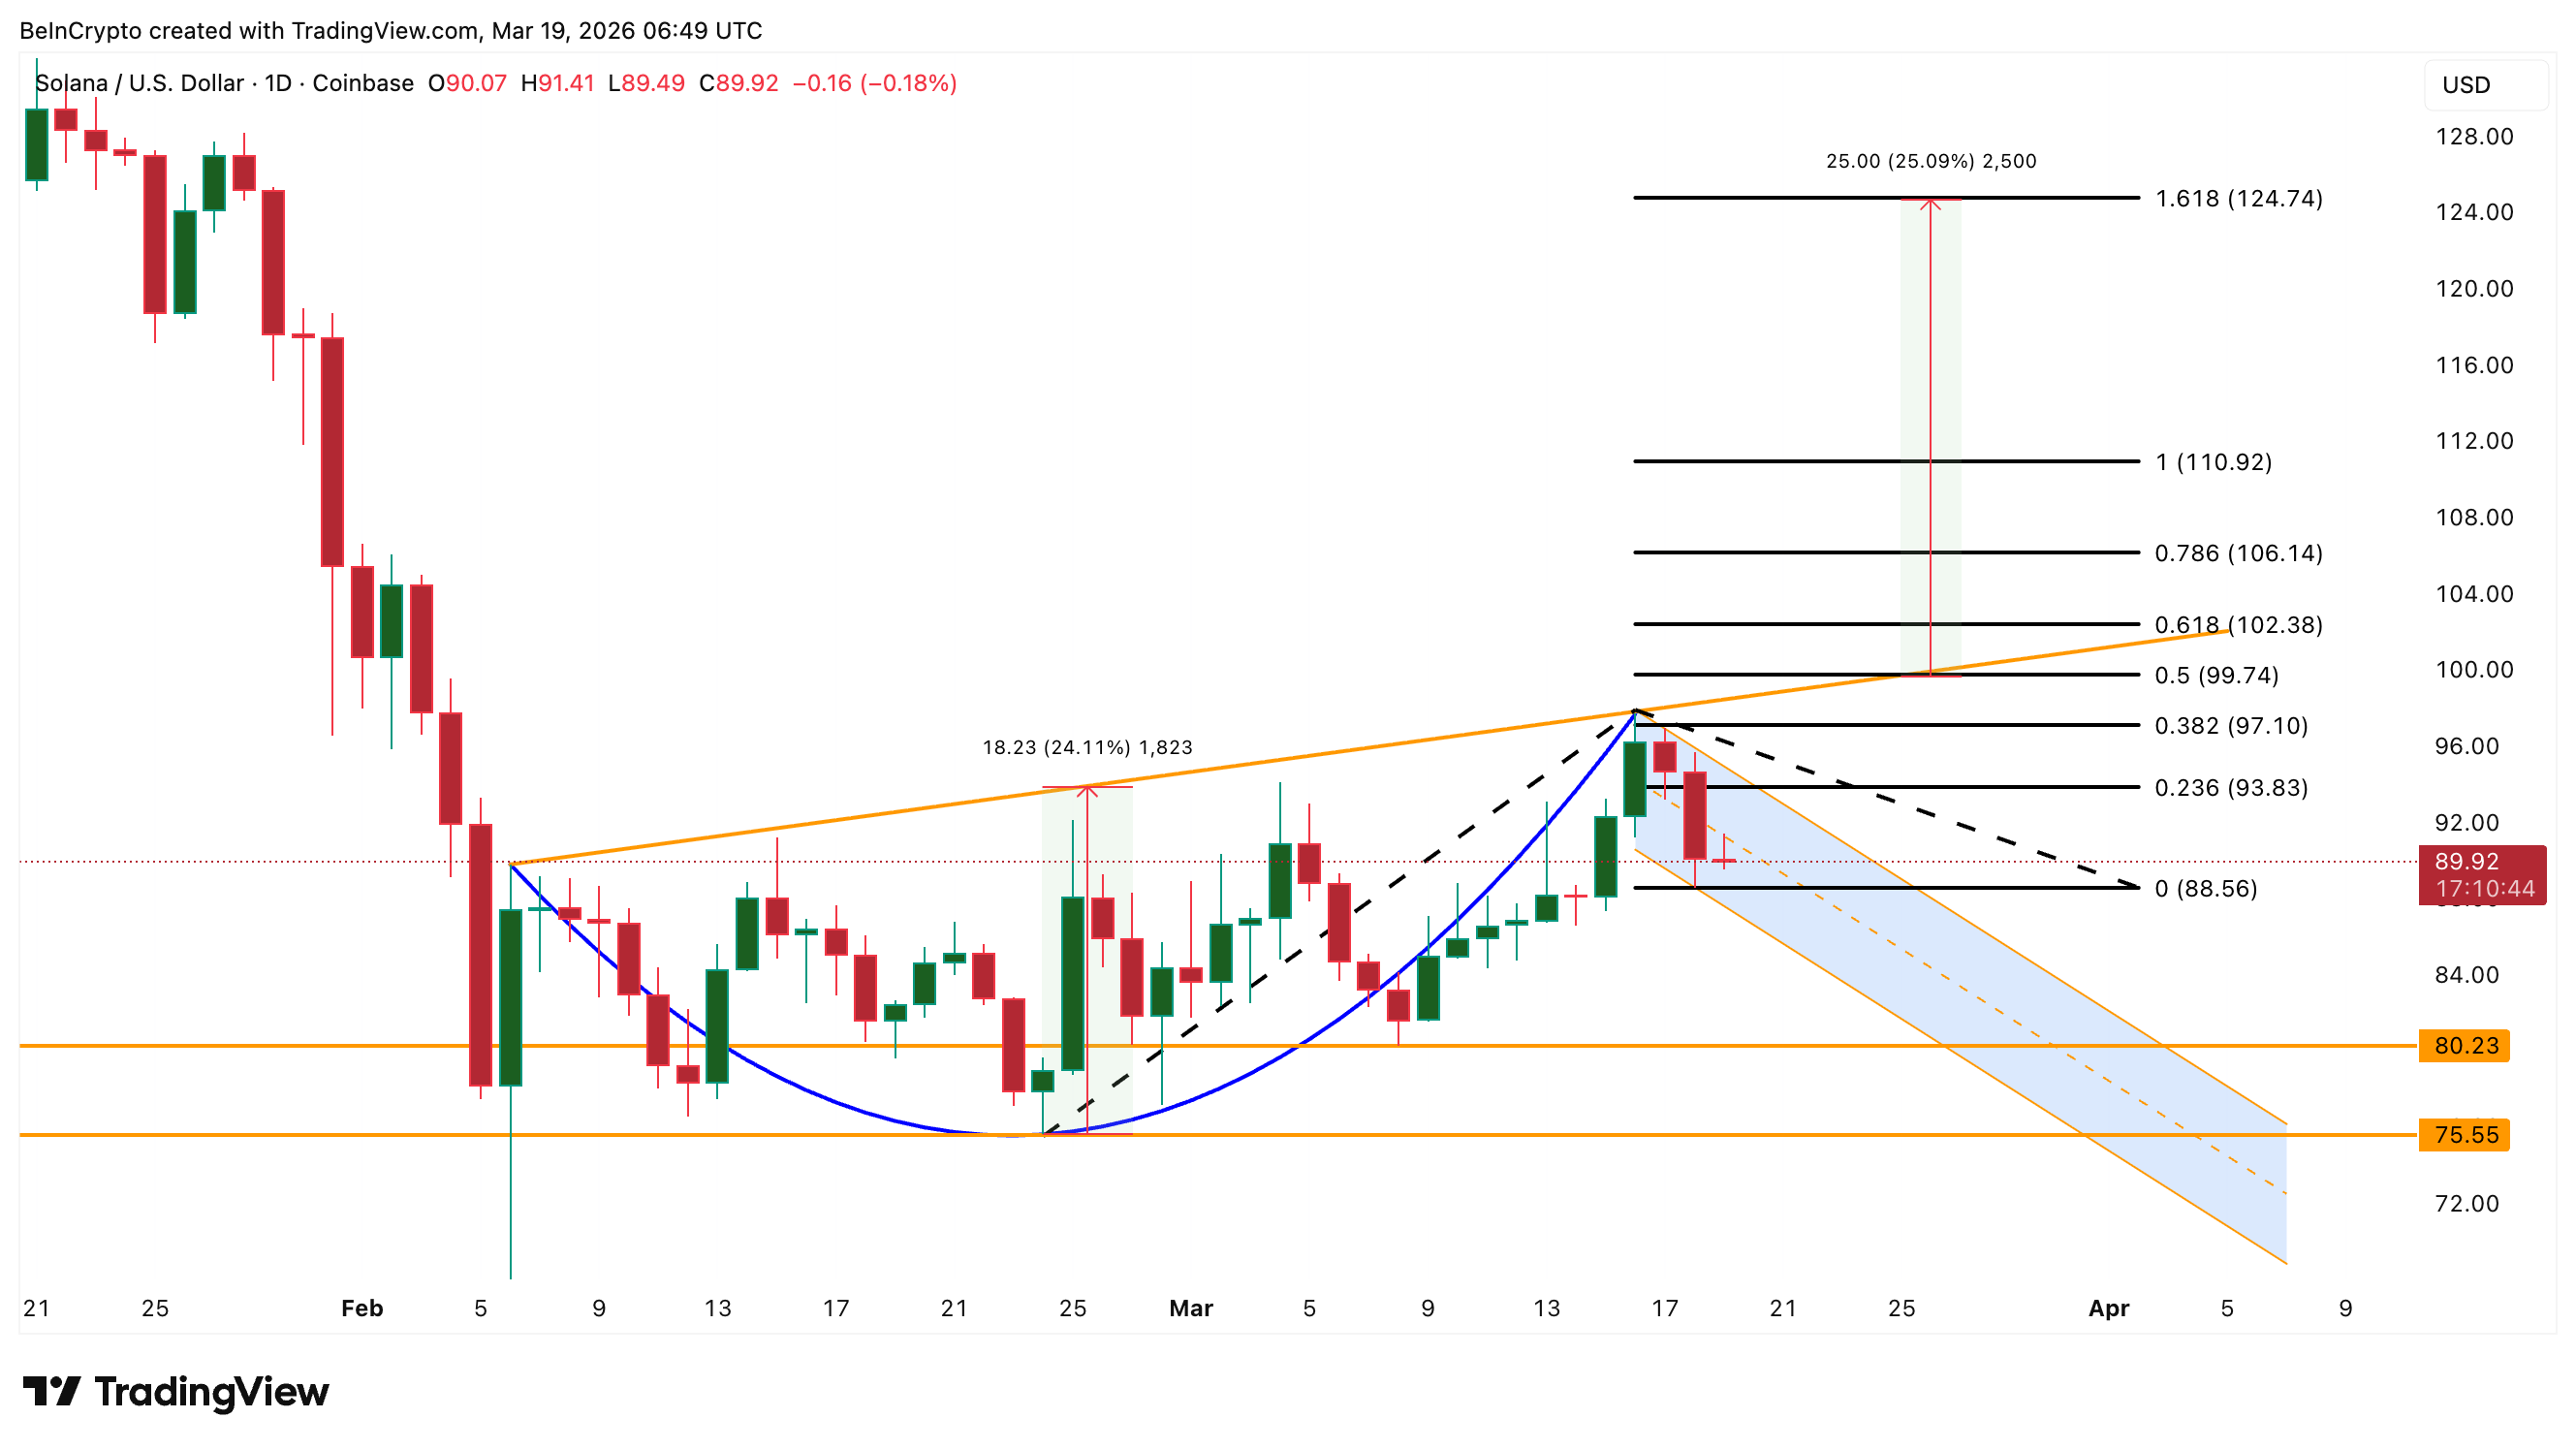
On the downside, $88 remains the first support, aligning with the 20-day EMA. A break below this level could extend the pullback. Below that, $80 becomes the next key level. If $75 breaks, the entire bullish structure would be invalidated.
 Solana Price Analysis: TradingView
On the upside, $93 is the first reclaim level, aligning with the 50-day EMA. Above that, $99 is the key breakout point. A move above $99 could confirm the pattern and trigger a rally of around 24%, with a potential target near $124.
Recommended Articles


