

3 Altcoins That Could Hit New All-Time Highs In The Second Week Of March 2026
Several altcoins are quietly approaching new all-time highs as capital rotates into selective mid-cap tokens during the second week of March. While the broader crypto market remains range-bound, a 3 projects are showing strong technical setups, momentum shifts, and renewed speculative demand.
If key resistance levels break, these tokens could move rapidly toward new all-time highs, potentially becoming some of the market’s biggest breakout stories this week.
Siren (SIREN)
Siren is emerging as one of the altcoins closely watched for new all-time highs in the second week of March. The AI-powered DeFi and meme hybrid token is currently trading near $0.46, roughly 24% below its previous all-time high near $0.60, formed in late February.
The token, bouncing 22% today, appears to be forming a bullish inverse head-and-shoulders pattern. The neckline of this formation aligns closely with SIREN’s previous all-time high near $0.60, making that level the most important breakout trigger for a potential move toward new all-time highs.
One catalyst supporting this setup is the recent reclaim of the 20-day EMA, or Exponential Moving Average, a moving price average that places greater weight on recent price movements to track short-term momentum. SIREN briefly lost this level on March 8 but quickly reclaimed it the same day.
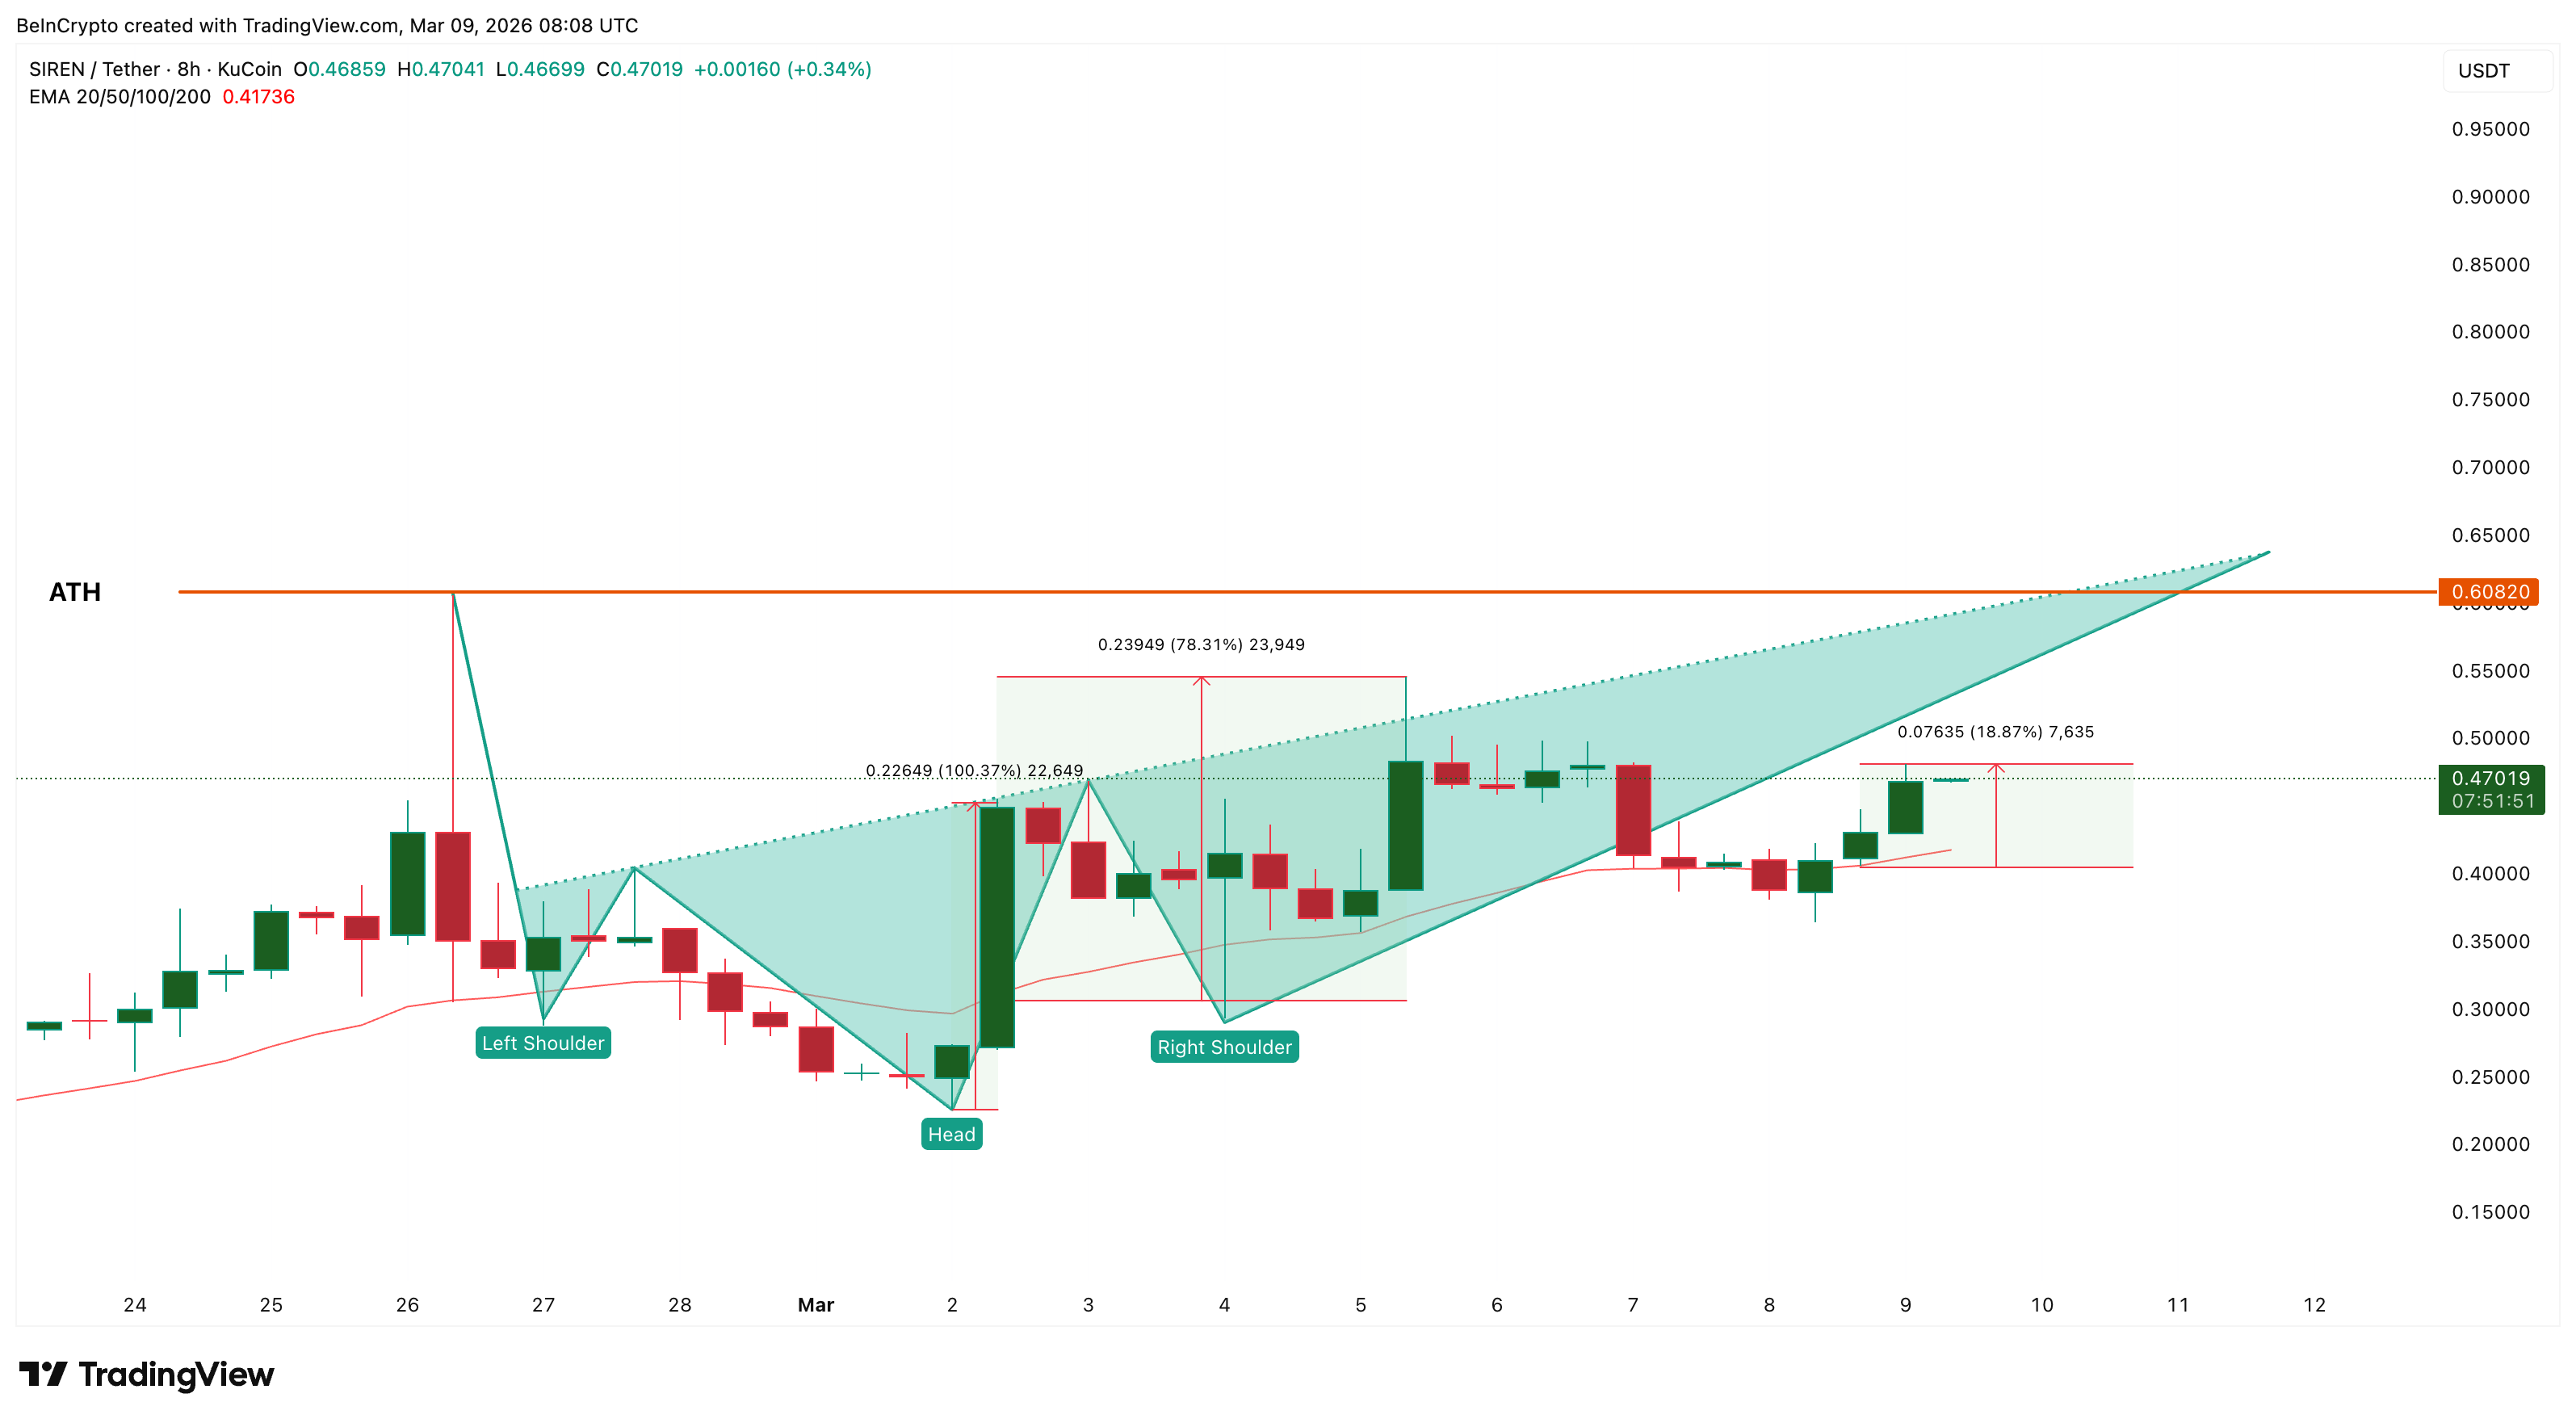 SIREN Price Structure: TradingView
Historically, reclaiming this EMA has preceded strong rallies. The last decisive reclaim on March 2 triggered a surge of nearly 78%. That pushed the token close to its neckline resistance before sellers stepped in.
Since the latest EMA reclaim, SIREN has climbed only about 18–19%. This suggests that there may still be room for further upside if momentum continues. A move toward $0.60, followed by a breakout above $0.61, would confirm a new all-time high. And that could open the door to a larger rally toward $1.20, based on the measured move of the pattern.
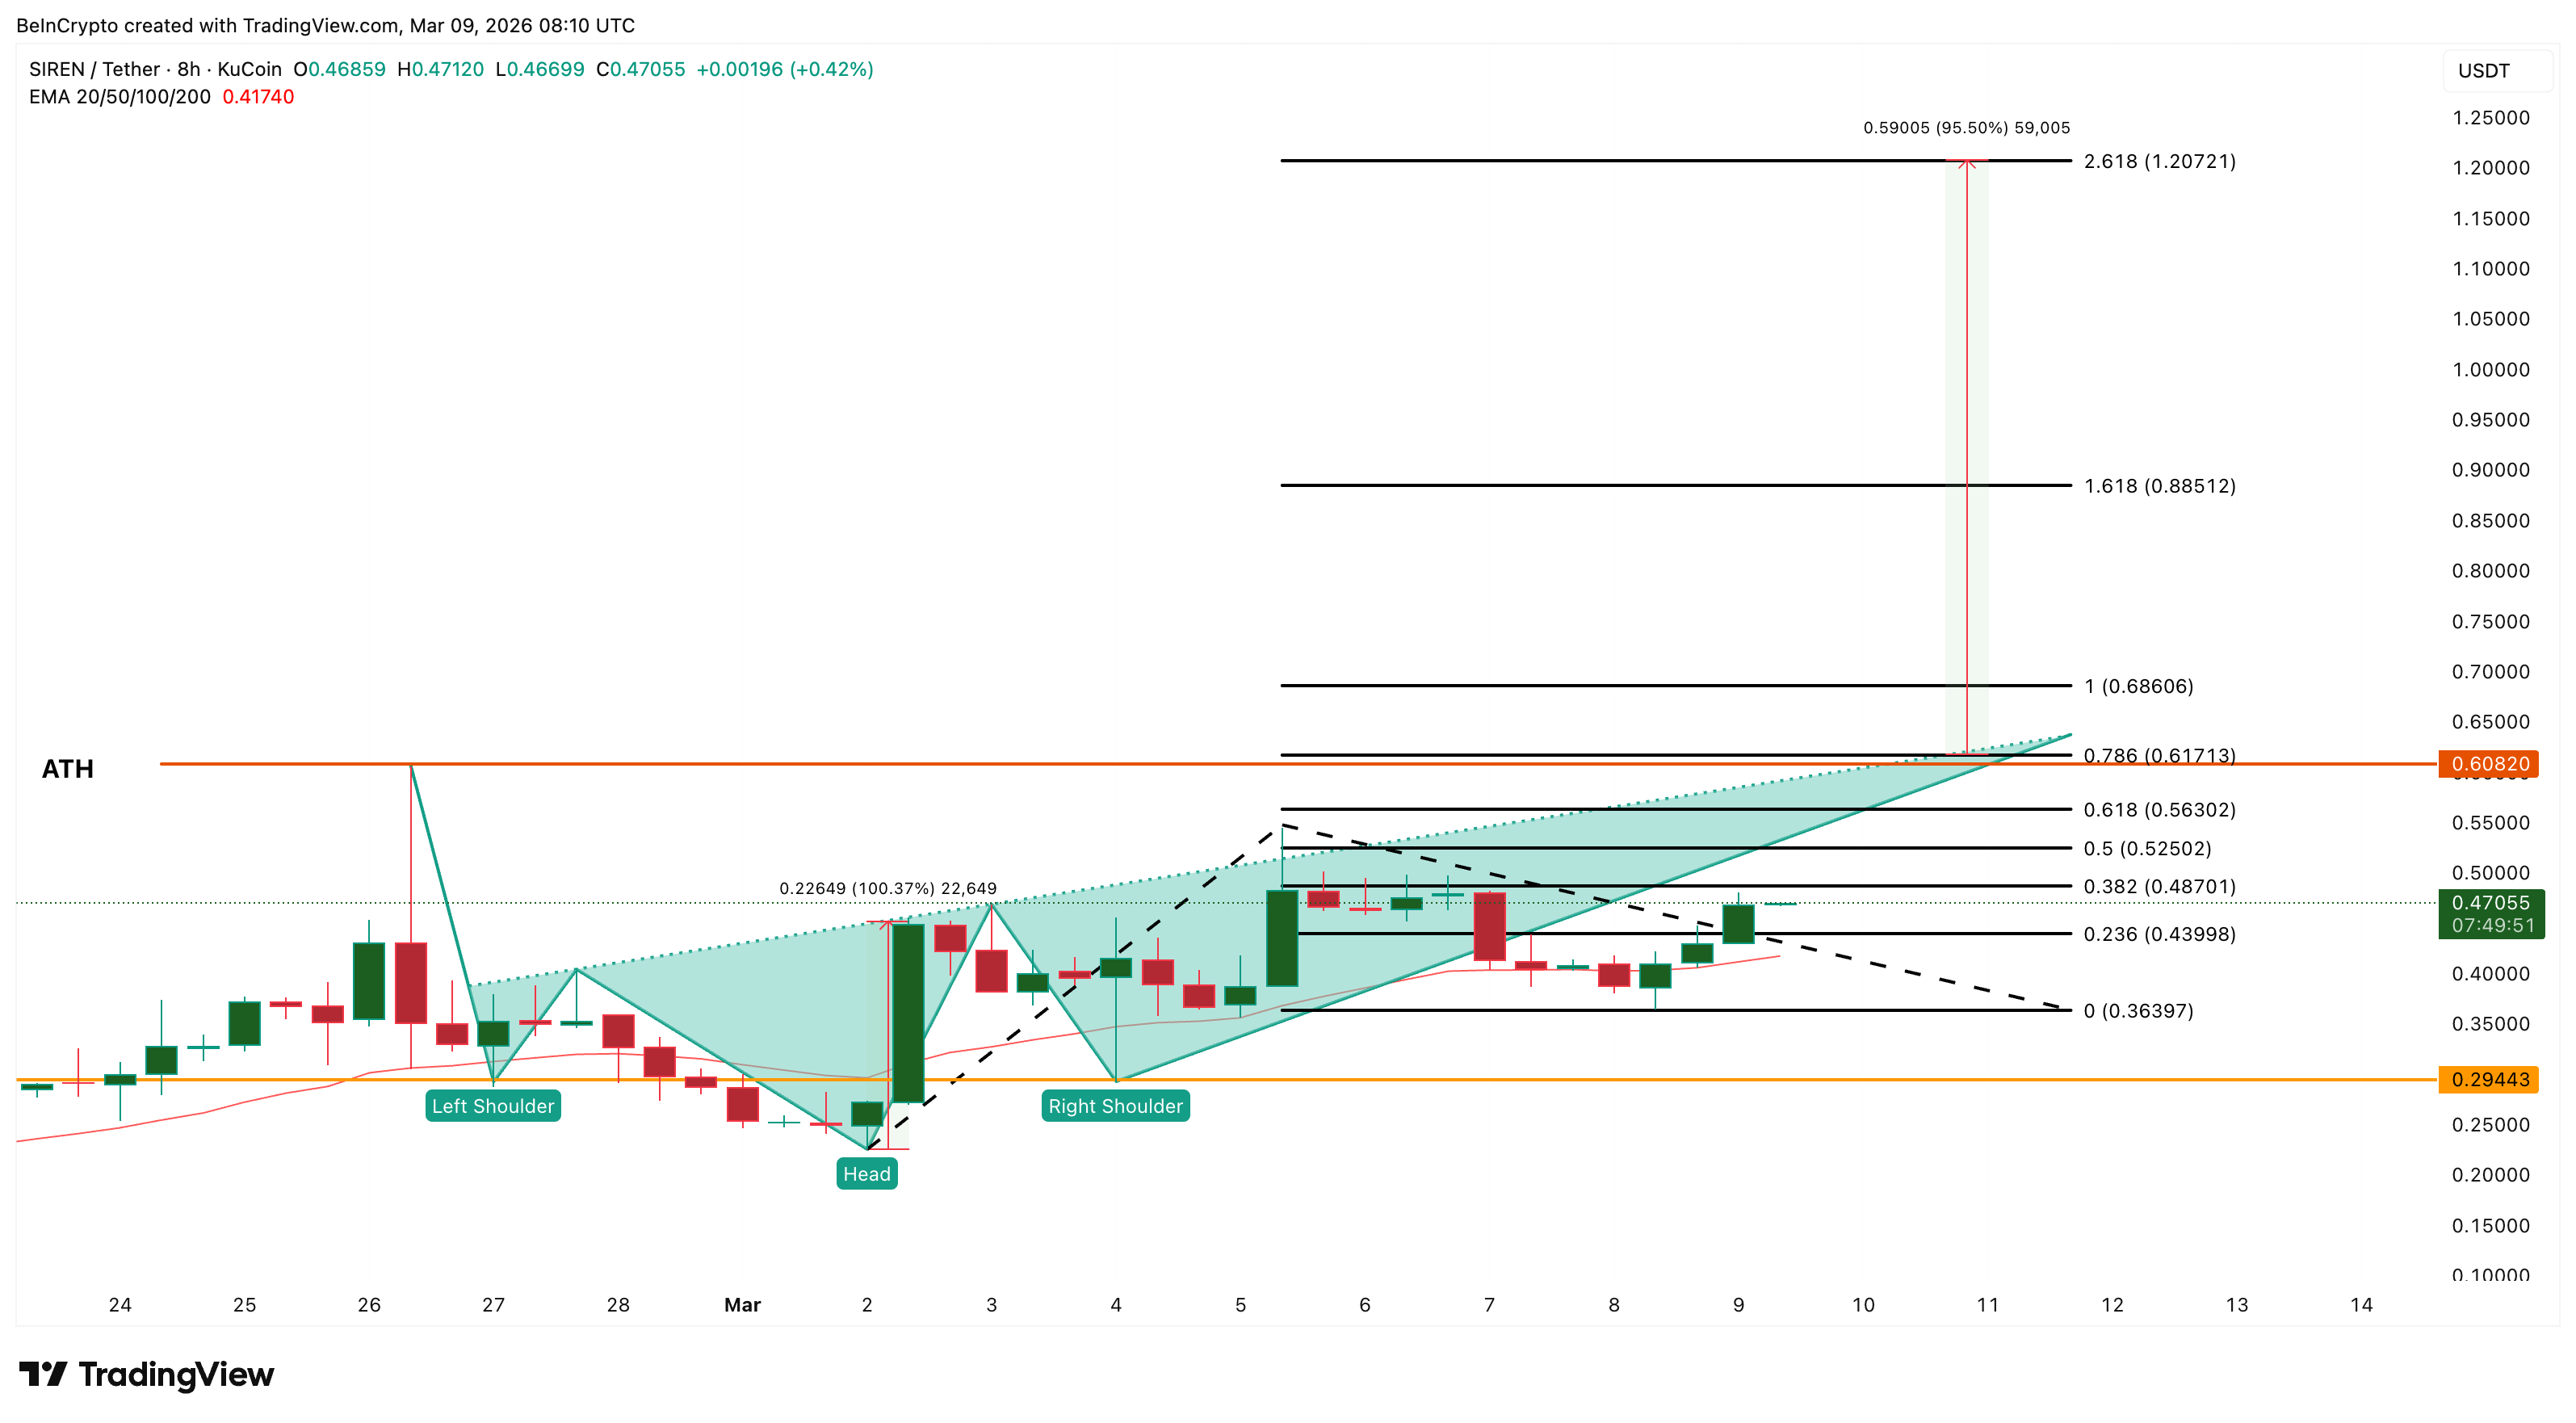 SIREN Price Analysis: TradingView
However, the bullish setup would weaken if SIREN falls below $0.36, which would damage the developing pattern. A deeper drop toward $0.29 could weaken the structure further by breaking below the right-shoulder support and shifting sentiment bearish.
Kite (KITE)
Kite (KITE) is another altcoin nearing a new all-time high in the second week of March. The token powers an EVM-compatible Layer-1 blockchain built for the AI agent economy, where autonomous AI agents can execute payments and automated transactions on-chain.
KITE is currently trading near $0.28, roughly 12% below its recent all-time high of $0.32 formed on March 6. The token has also climbed about 94% over the past month, making it one of the stronger mid-cap performers as capital rotates into altcoins approaching new all-time highs.
From a technical perspective, KITE continues to trade inside an ascending channel, a structure formed by higher highs and higher lows within two rising trendlines. This pattern reflects a steady uptrend rather than a sharp speculative spike.
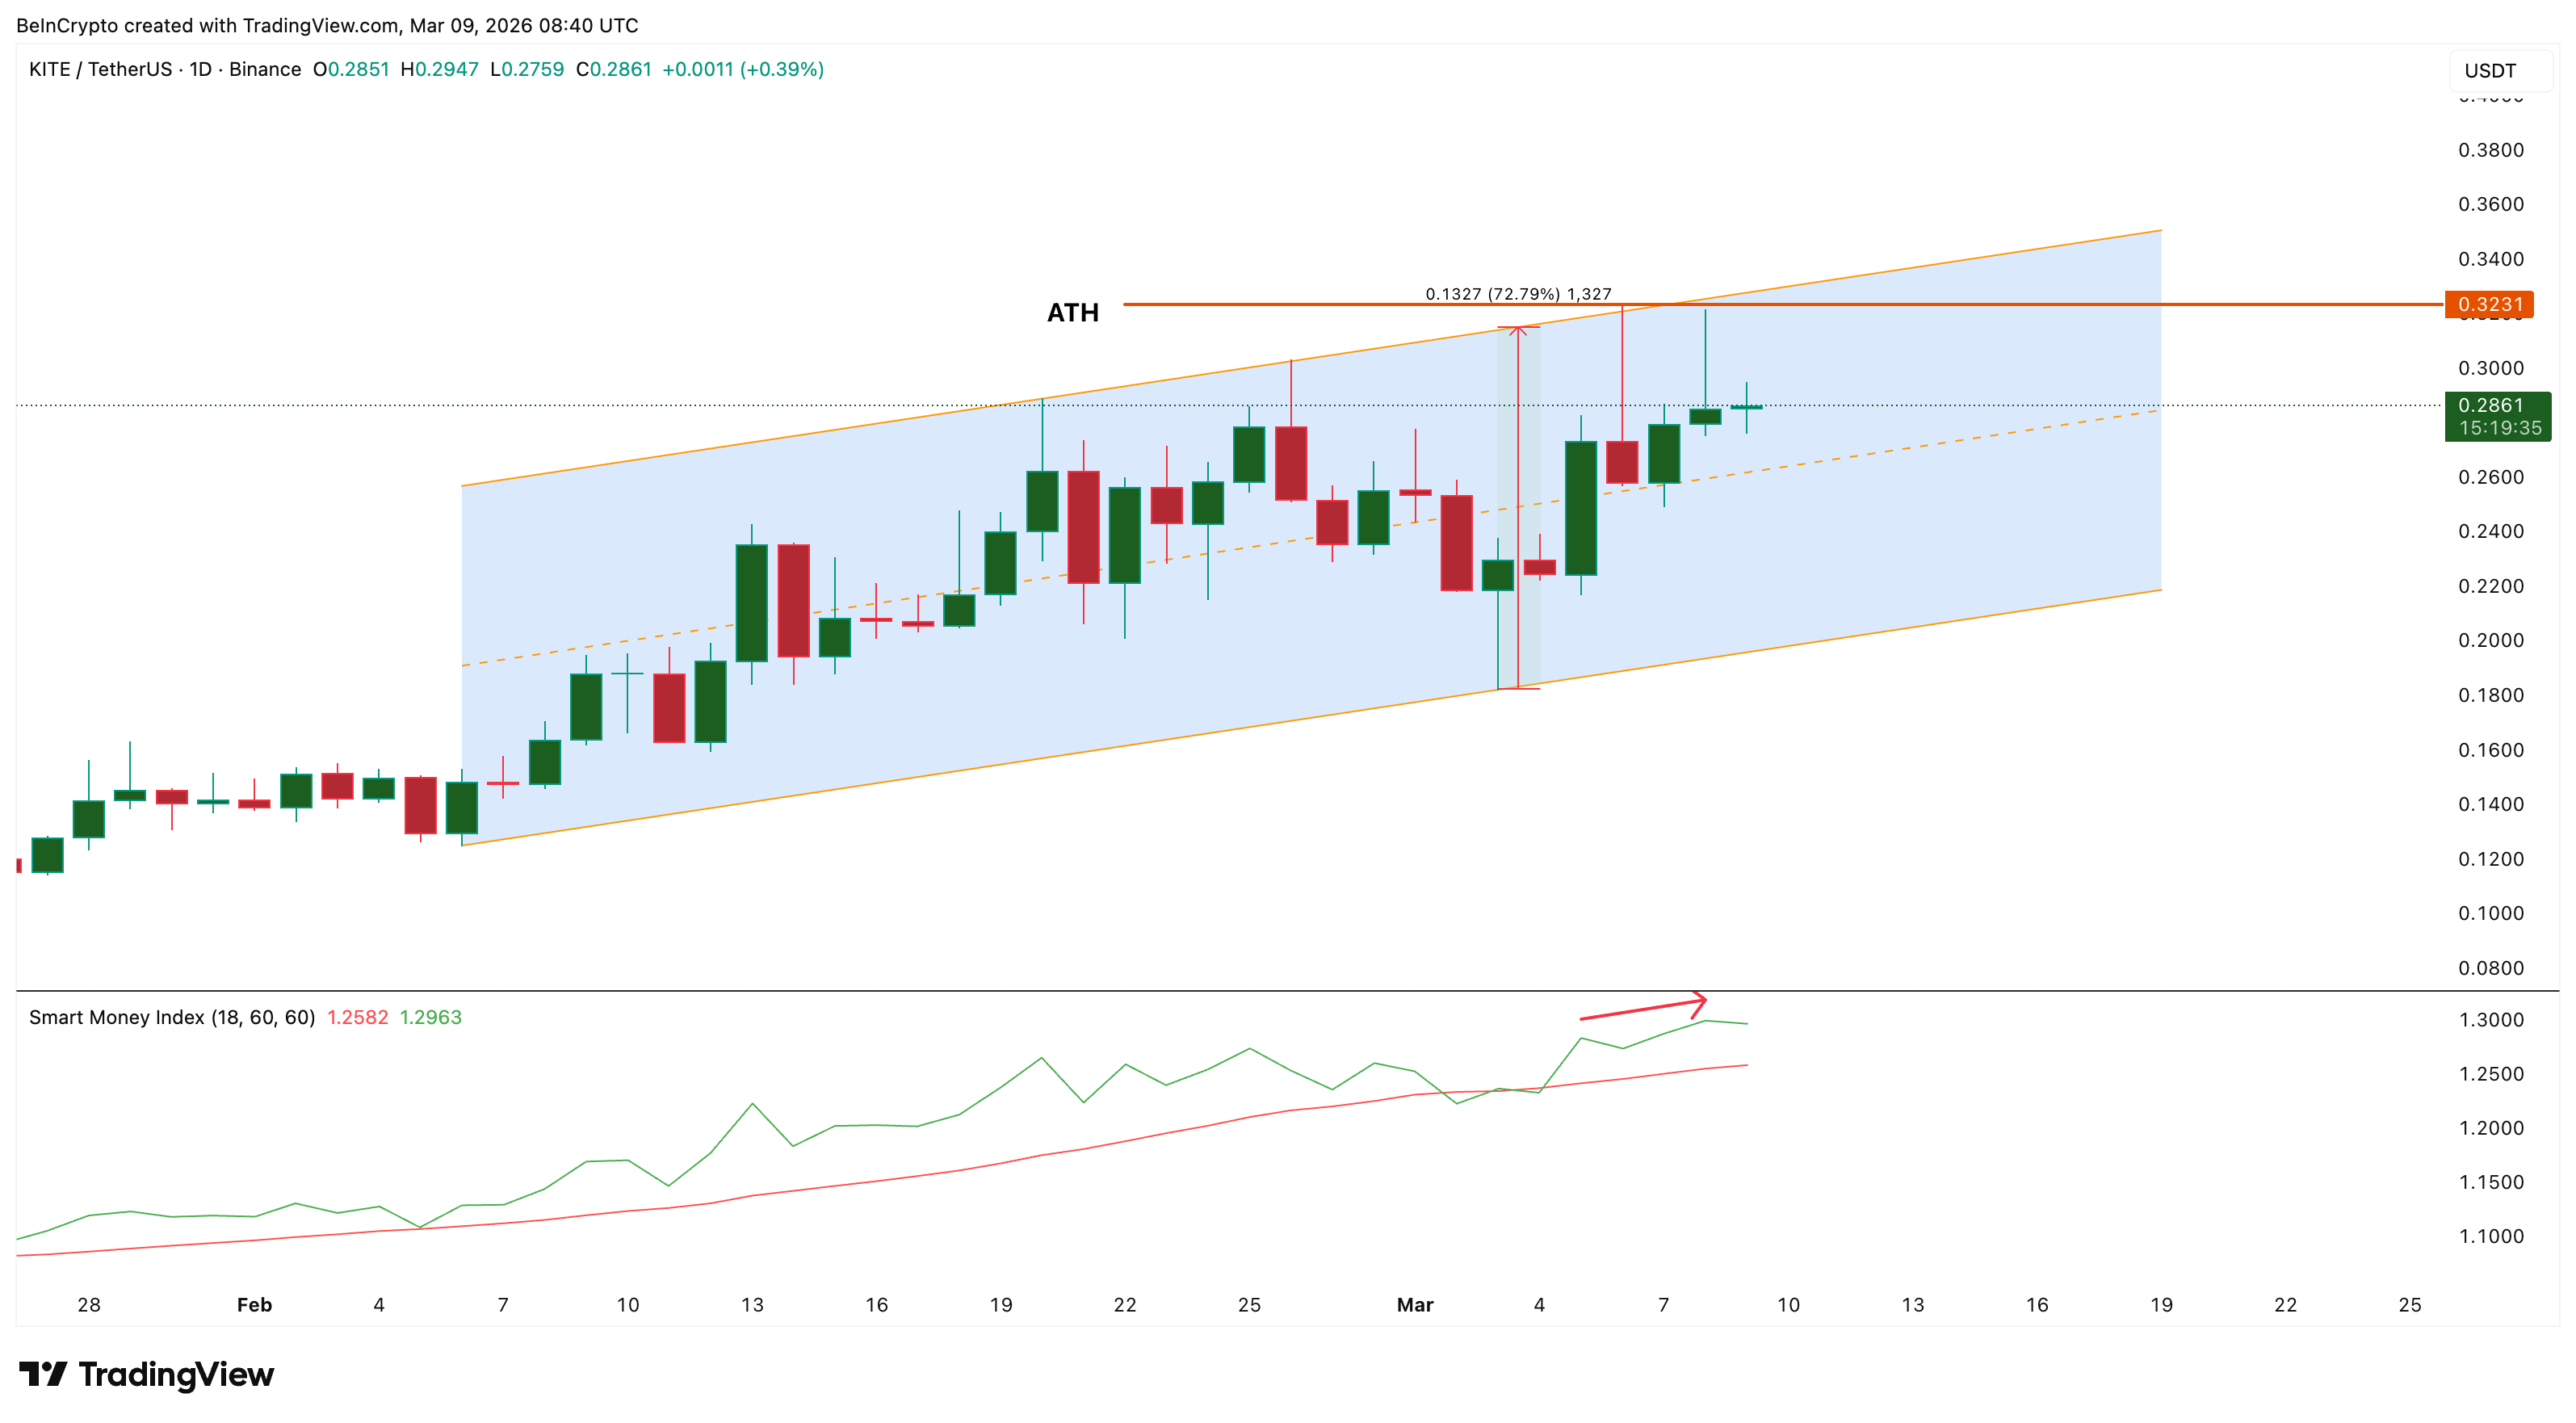 KITE Price Structure: TradingView
Want more token insights like this? Sign up for Editor Harsh Notariya’s Daily Crypto Newsletter here.
Momentum is also supported by the Smart Money Index (SMI), an indicator designed to track positioning from informed traders. On March 4, the SMI moved above its signal line and has continued trending higher alongside price, suggesting sustained buying interest from experienced market participants.
If KITE manages to break above the $0.32 all-time high, the next resistance sits near $0.34 along the upper channel boundary. A breakout from this structure could open the door toward $0.57–$0.60, establishing a new all-time high zone.
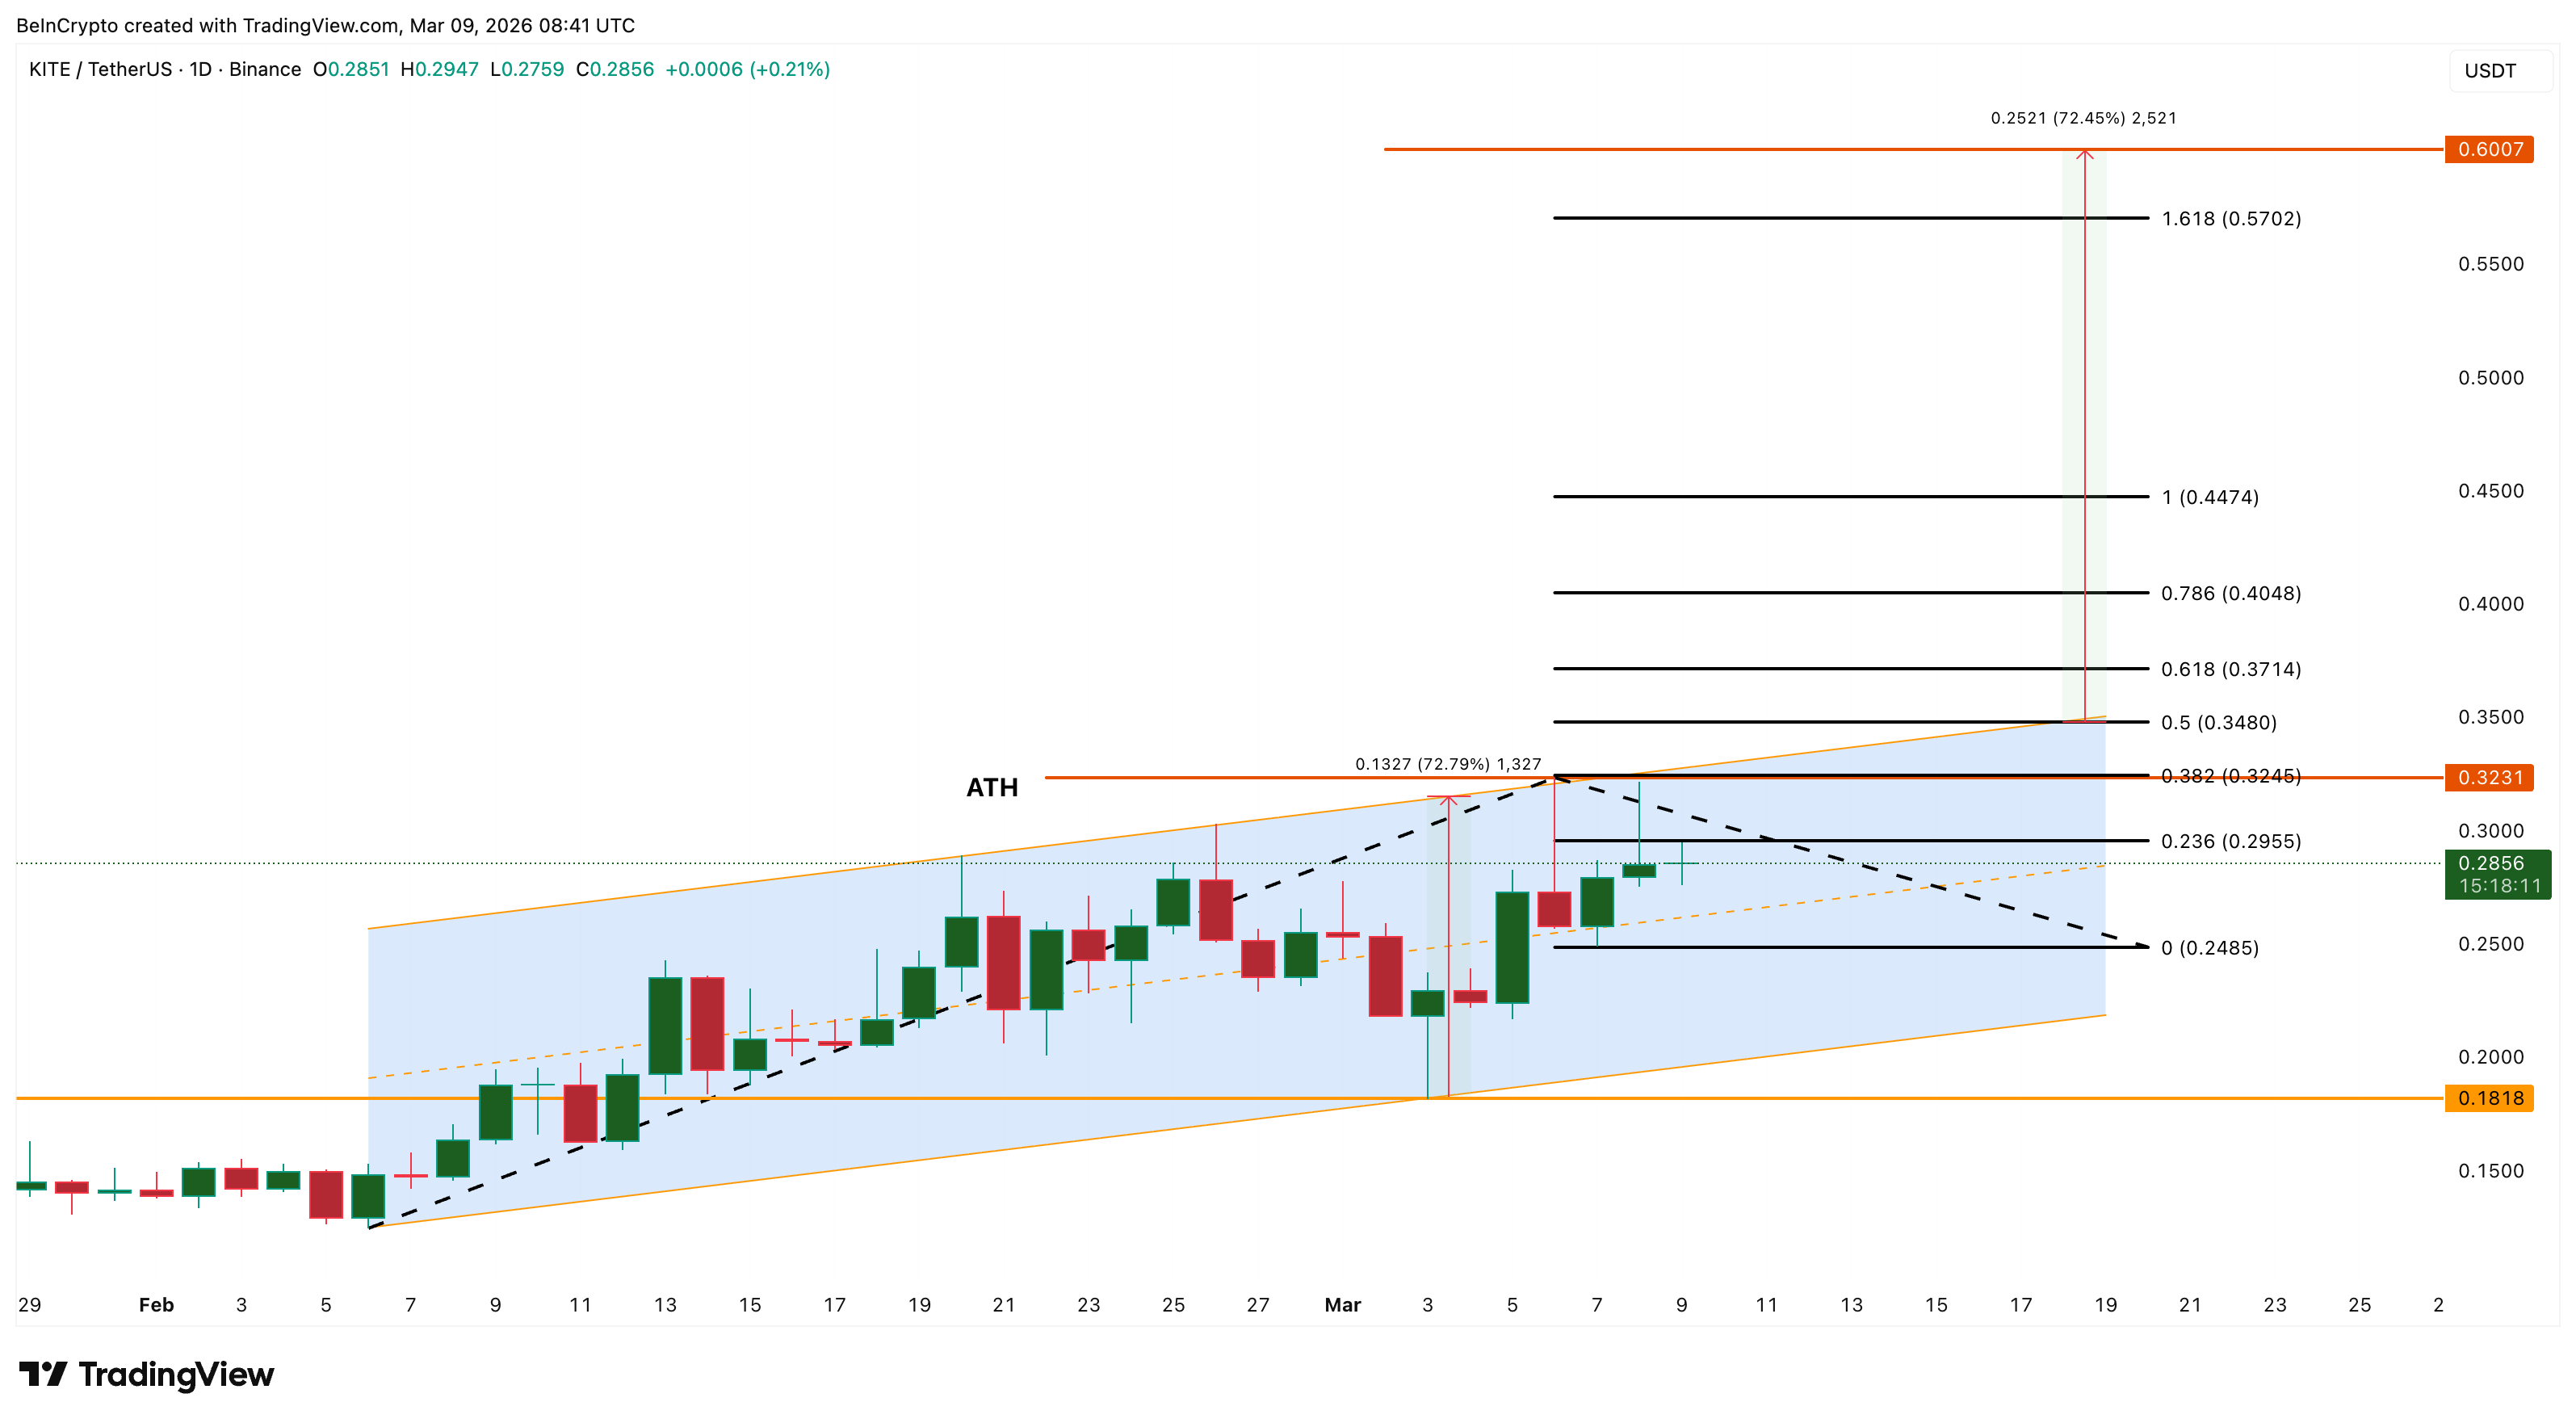 KITE Price Analysis: TradingView
However, the bullish outlook would weaken if the price falls below $0.24. A deeper drop toward $0.18 could invalidate the structure and delay the move toward new all-time highs.
Rain (RAIN)
Another altcoin that could attempt new all-time highs in the second week of March is RAIN. Yet, its current structure looks weaker compared with other tokens on the list. RAIN is the utility and governance token of a decentralized prediction market protocol on Arbitrum. And prediction markets are quite hot in 2026.
At press time, RAIN is trading near $0.0088. It is roughly 18–19% below its all-time high of about $0.0115, which was recorded on February 9. Since forming that peak, the token has been moving inside a descending channel. This pattern typically reflects a gradual short-term downtrend.
Price action inside this channel has also produced candles with long wicks, indicating that both buyers and sellers remain active at similar levels. This often signals that the market is searching for direction rather than committing strongly to a single trend.
However, a subtle shift in momentum is appearing on the Relative Strength Index (RSI). RSI is a momentum indicator that measures the speed and strength of price movements on a scale from 0 to 100. Between March 4 and March 8, price revisited roughly the same support zone while RSI moved lower, suggesting that selling momentum may be fading. This type of structure can sometimes precede a rebound attempt during corrective phases.
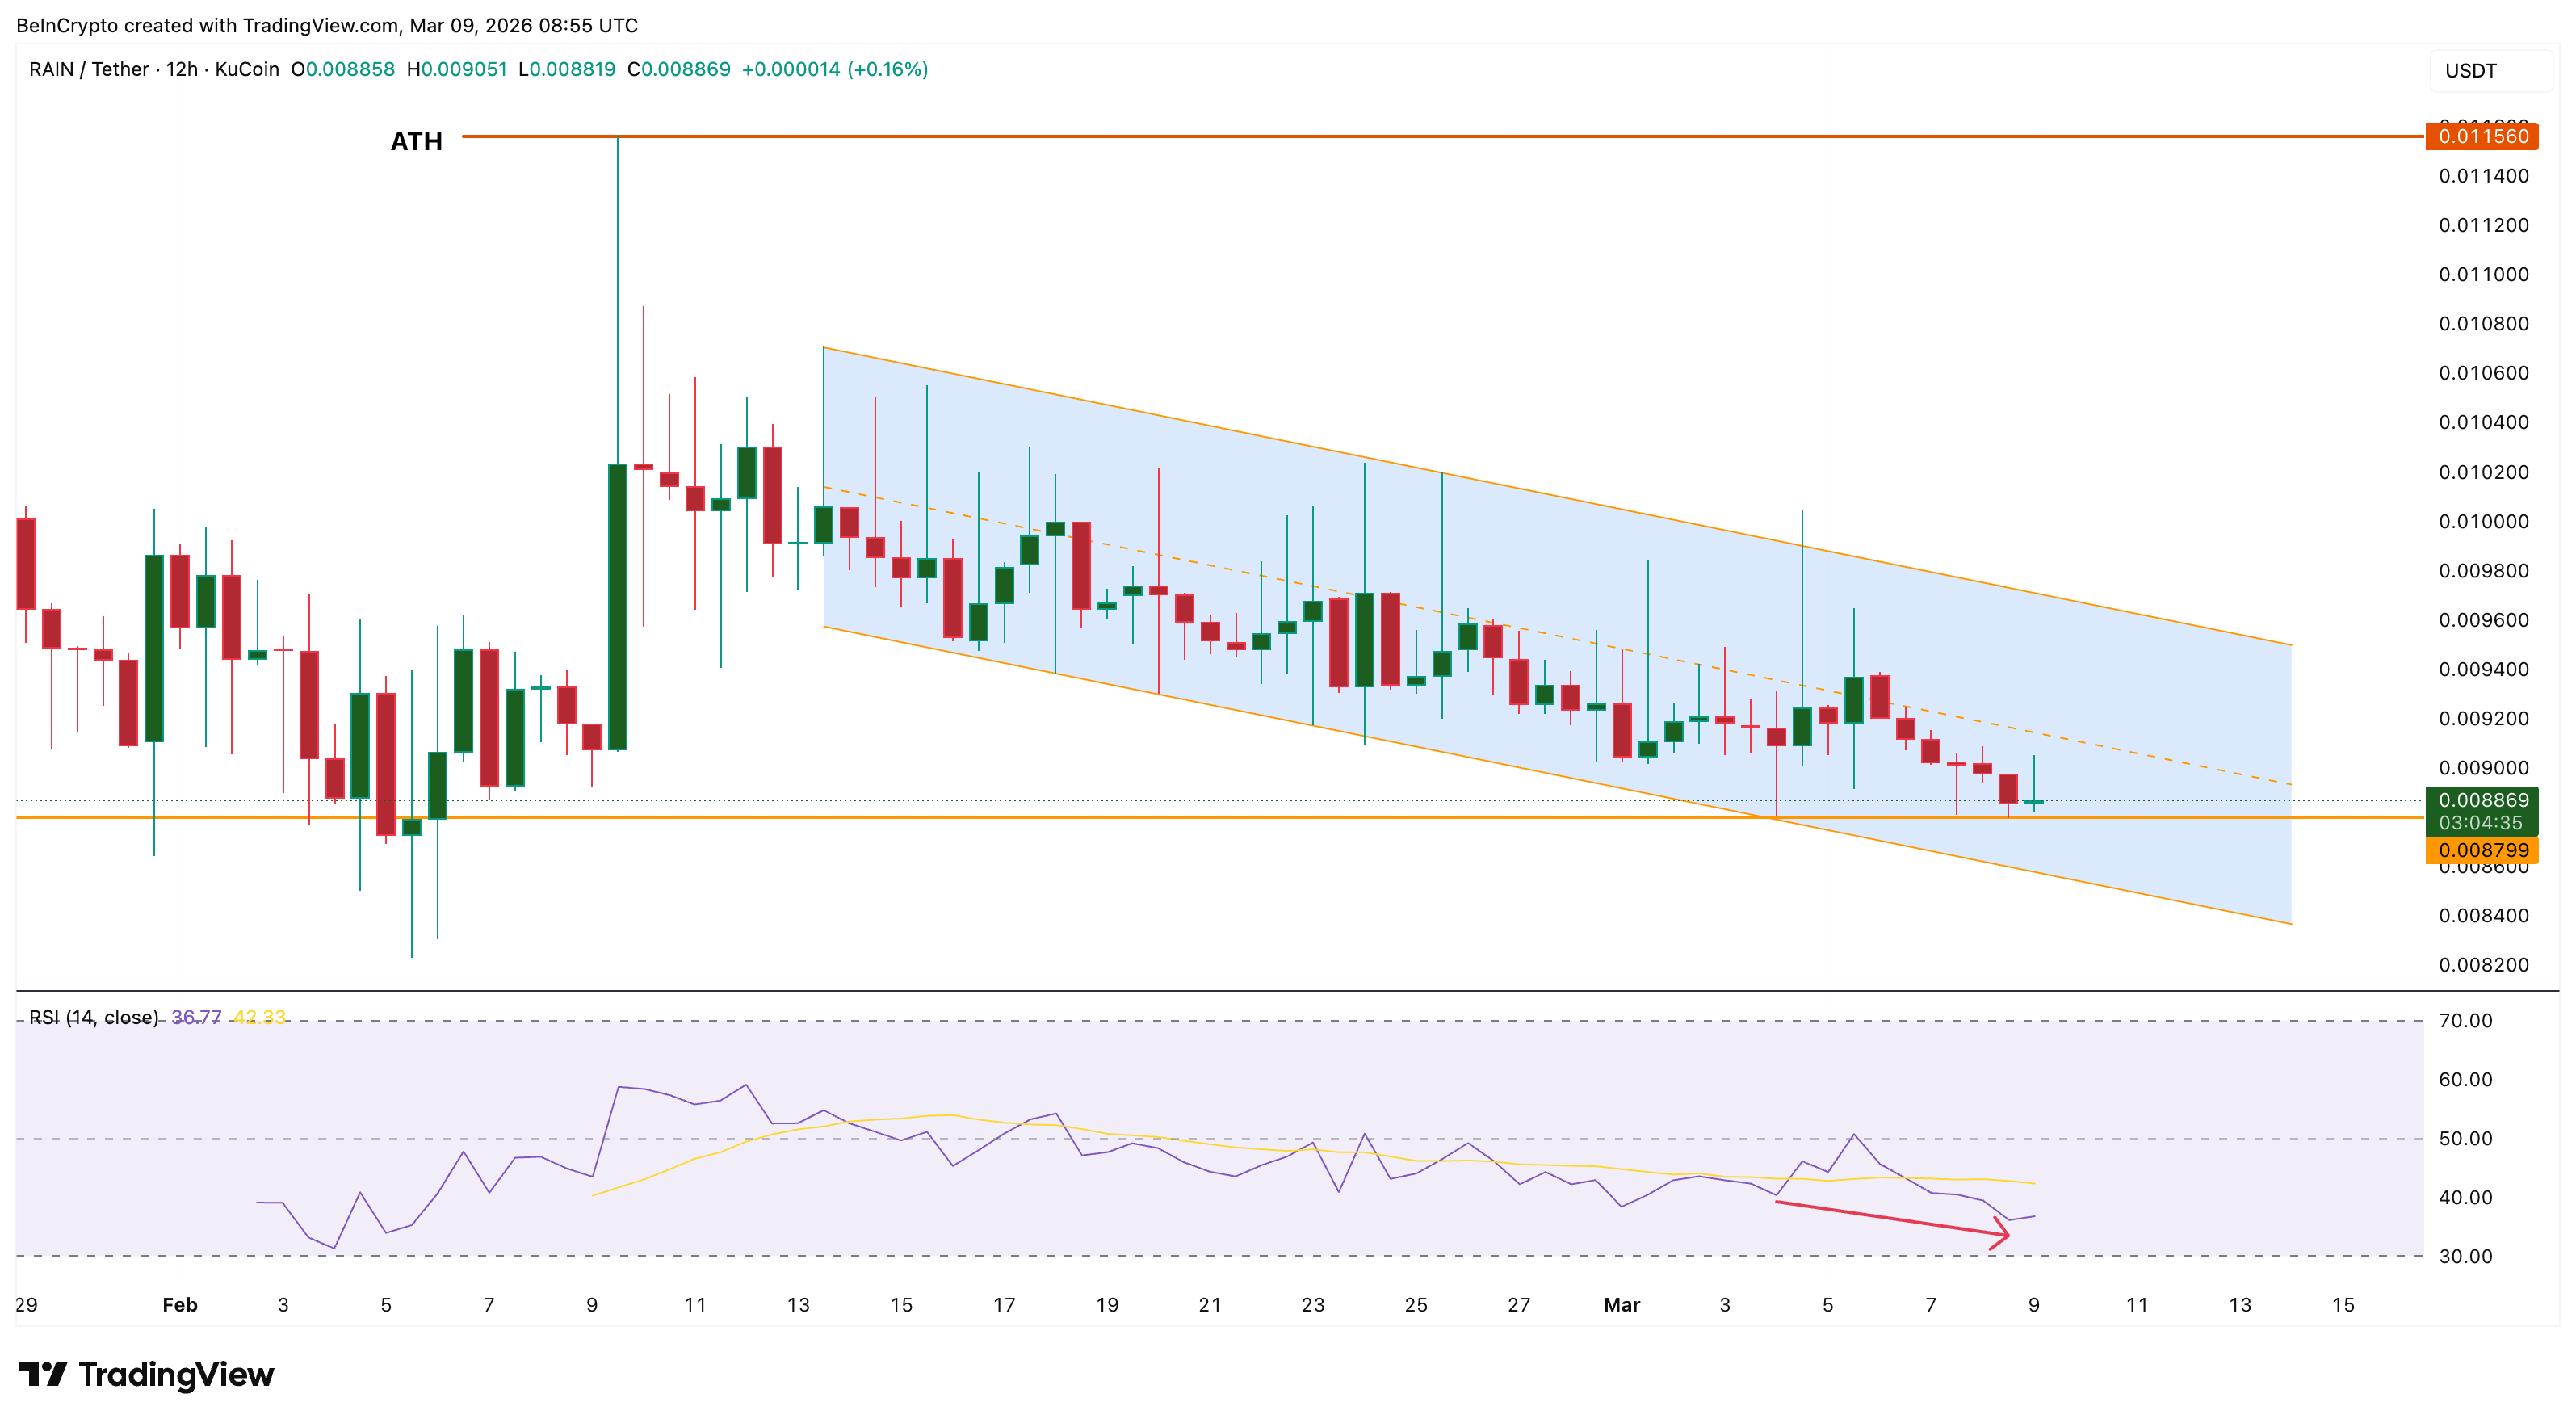 RAIN Price Structure: TradingView
For RAIN to regain bullish momentum, the price first needs to reclaim $0.0094. A move above $0.0098 would break the descending channel and signal improving strength. If buyers push the token above $0.0105, the market could begin moving back toward its $0.0115 all-time high. That would reopen the possibility of new all-time highs.
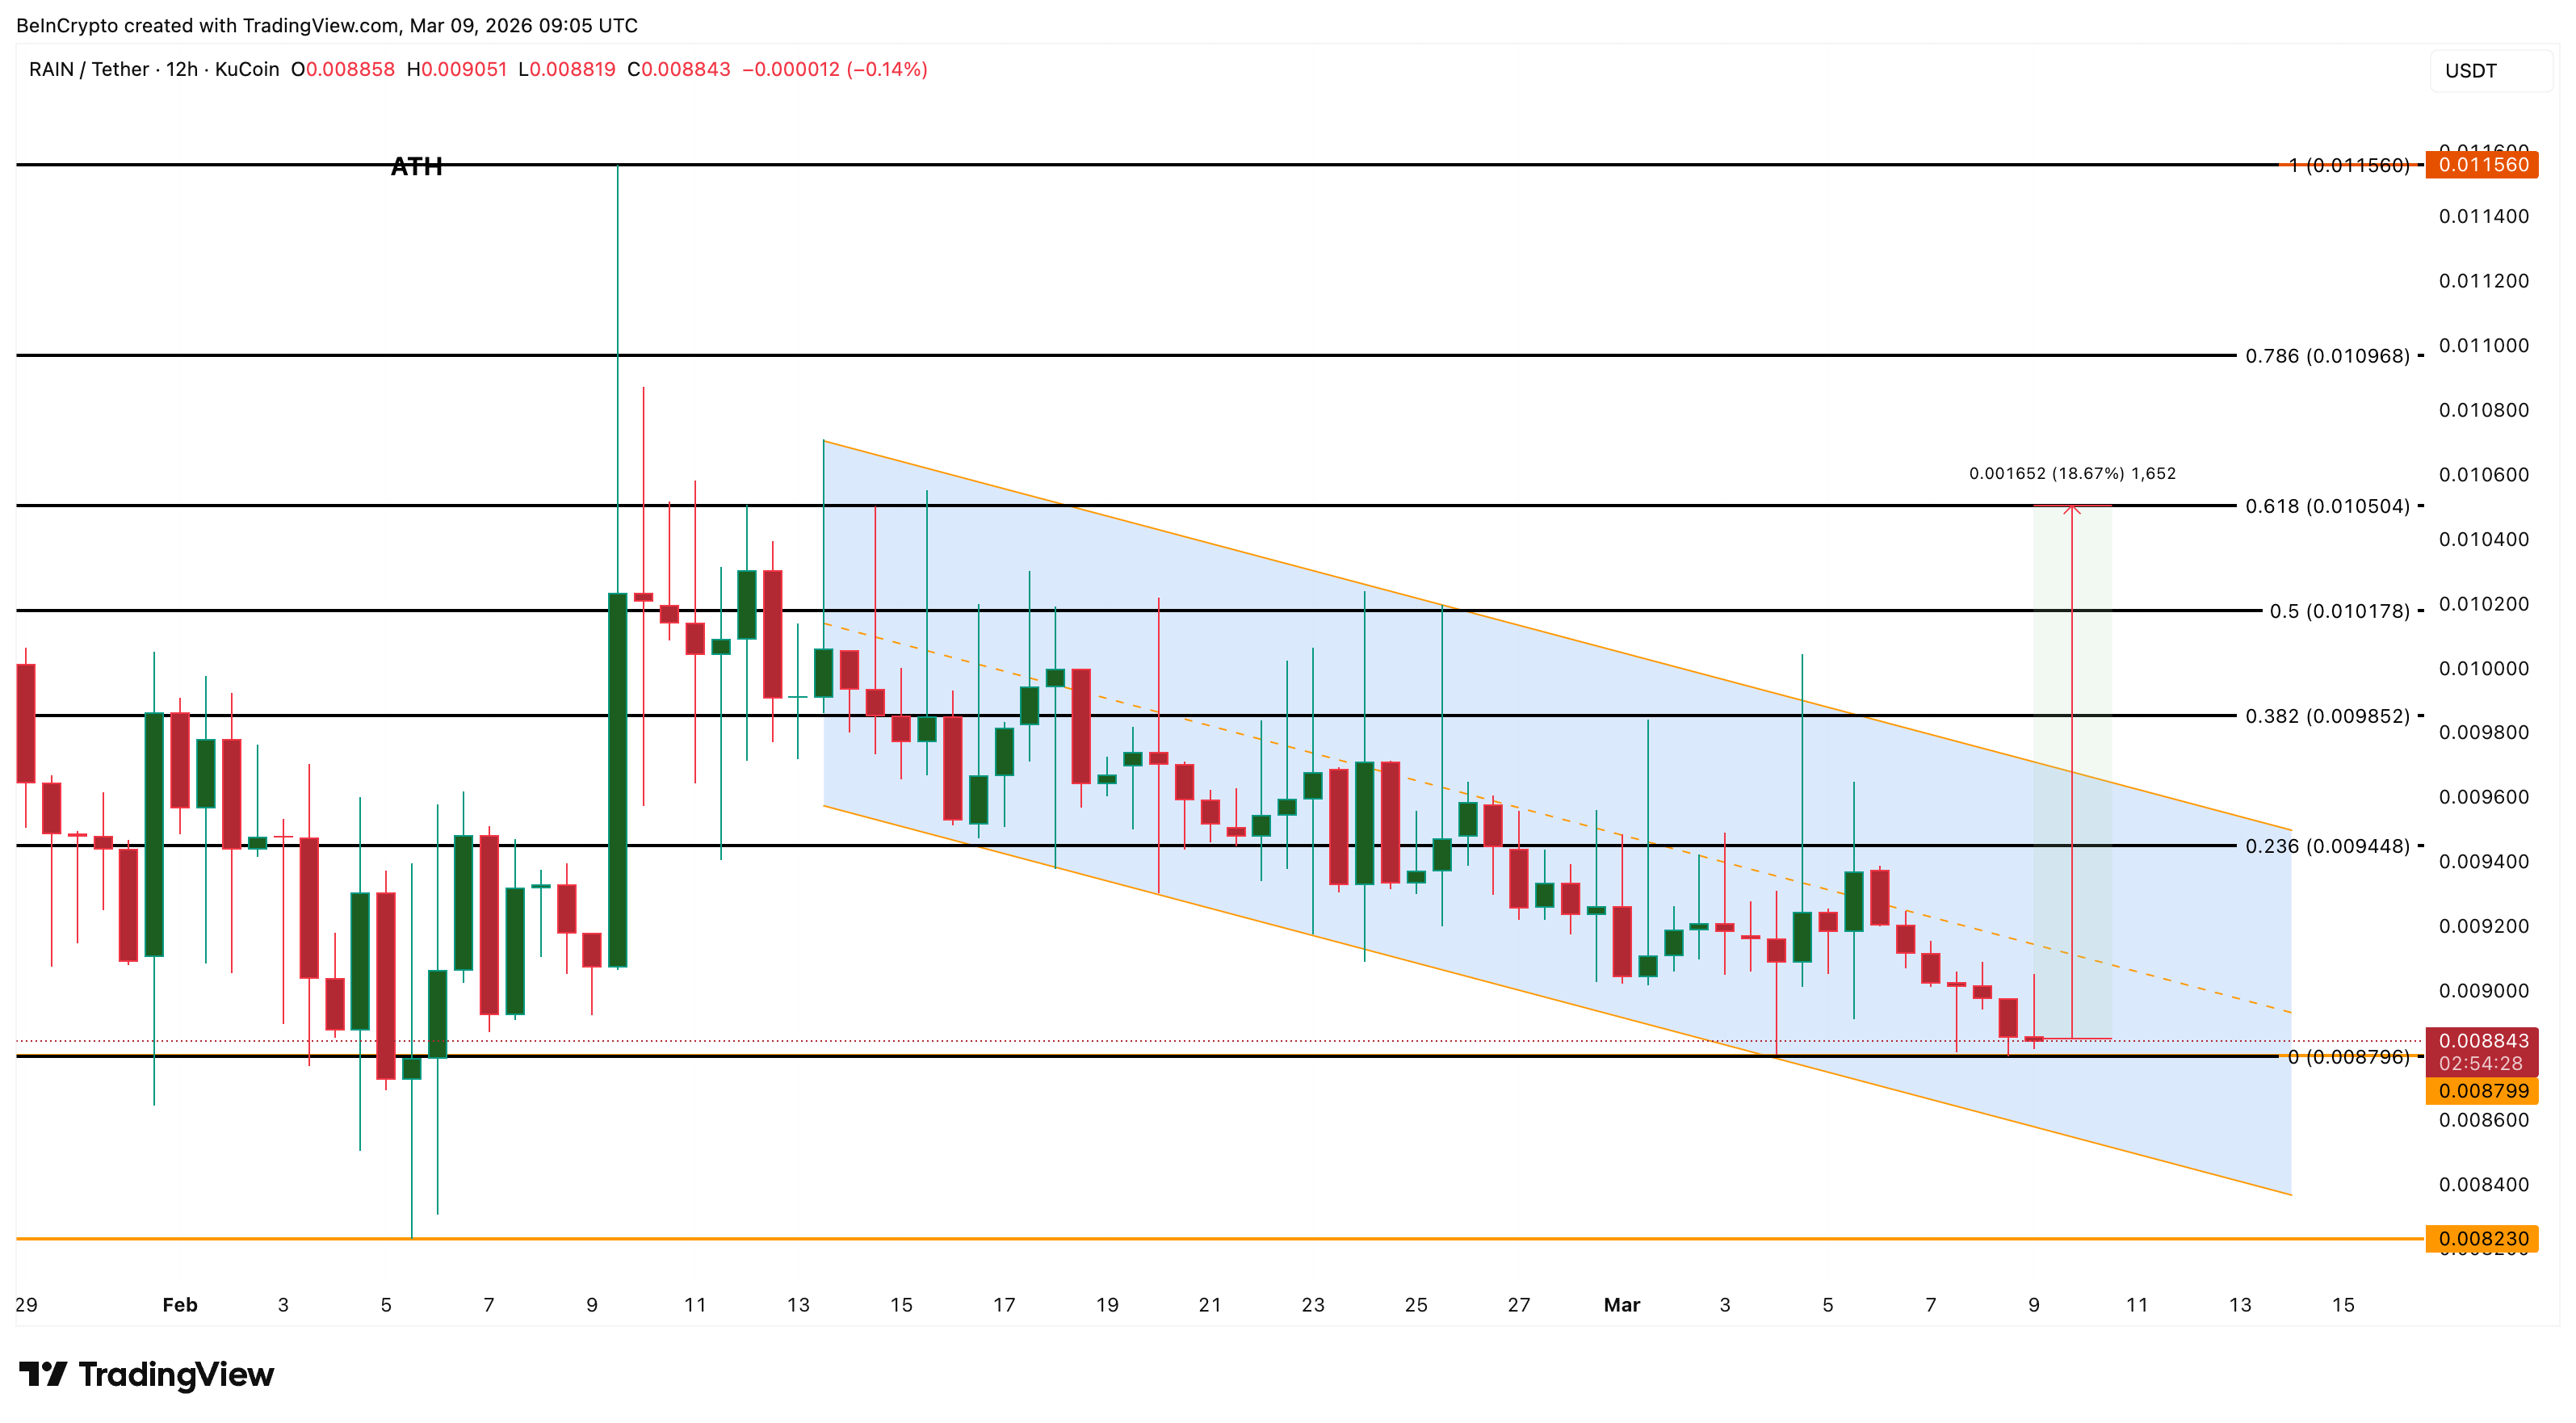 RAIN Price Analysis: TradingView
However, the setup would weaken if RAIN records a 12-hour close below $0.0087. That could extend the current downtrend and delay the attempt to revisit record levels.
Recommended Articles


