

Bitcoin On-Chain Heatmap Shows All Major Metrics In The Red
Some key on-chain indicators are flashing a red signal for Bitcoin, suggesting bearish market conditions for the number one cryptocurrency.
Major On-Chain Indicators Are In Red Zone For Bitcoin
In a new post on X, CryptoQuant author Darkfrost has talked about what on-chain indicators are suggesting for the current Bitcoin market. The analyst has shared a heatmap that shows the signals 10 metrics related to the cryptocurrency are flashing right now.
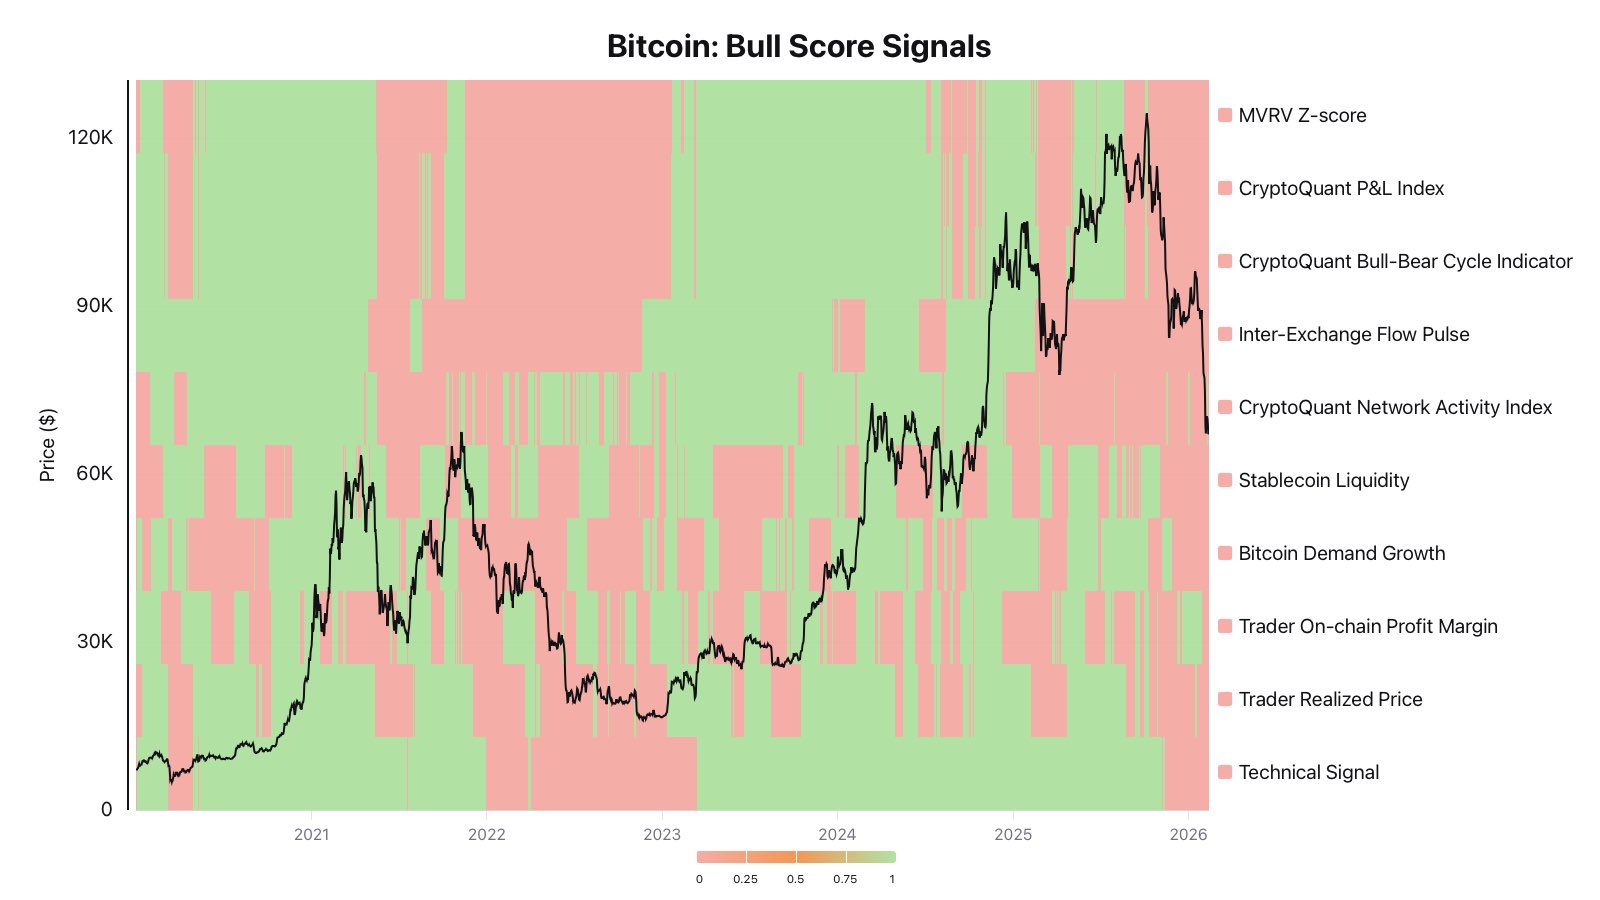
The indicators in the graph are all key on-chain metrics covering different dimensions of the network. For example, the MVRV Z-Score deals with general investor profitability, while the Trader Realized Price and Trader On-chain Profit Margin specifically track the profit-loss status of the short-term holders.
All the indicators in the heatmap are currently giving a red signal, implying conditions aren’t favorable for a bull market. “As long as that remains the case, it is hard to imagine BTC reaching new highs in the short term,” noted Darkfrost.
Red has spread on the heatmap as the cryptocurrency’s price has gone through its bearish price action. A couple of metrics, however, have been bearish since even before the market downturn. The indicators in question are the Inter-Exchange Flow Pulse and CryptoQuant Network Activity Index.
The former of these tracks the flows occurring between spot and derivatives exchanges. This metric being bearish means that there is a lack of speculative push in the market. From the chart, it’s visible that the Inter-Exchange Flow Pulse went red during the drawdown phase from the first half of 2025 and has remained so since then.
The CryptoQuant Network Activity Index, gauging the transaction activity occurring on the Bitcoin blockchain, left the bull territory in late 2024. Activity on the network has since mostly maintained at bearish levels, except for a few brief flashes.
Most of the other metrics didn’t turn red until the November 2025 price decline. The last metric to go red was the Trader On-Chain Profit Margin, which was green during the January recovery rally, but gave the bear signal after the most recent price plunge.
In some other news, the Bitcoin short-term holders have shown signs of loss-taking recently, as CryptoQuant community analyst Maartunn has highlighted in an X post. The short-term holder cohort includes the BTC investors who purchased their coins during the past 155 days.
As the below chart shows, these holders have ramped up their loss deposits to exchanges recently.

Investors usually transfer their tokens to centralized exchanges when they want to participate in selling, so these loss deposits can be a sign that some short-term holders are capitulating.
BTC Price
At the time of writing, Bitcoin is trading around $65,300, down more than 2% in the last week.
Recommended Articles


