Pi Network Price Forecast: PI bulls resurface at a crucial support level

Source Fxstreet
  • Pi Network holds steady above $0.1350 on Friday after rising over 2% the previous day from a crucial support level.
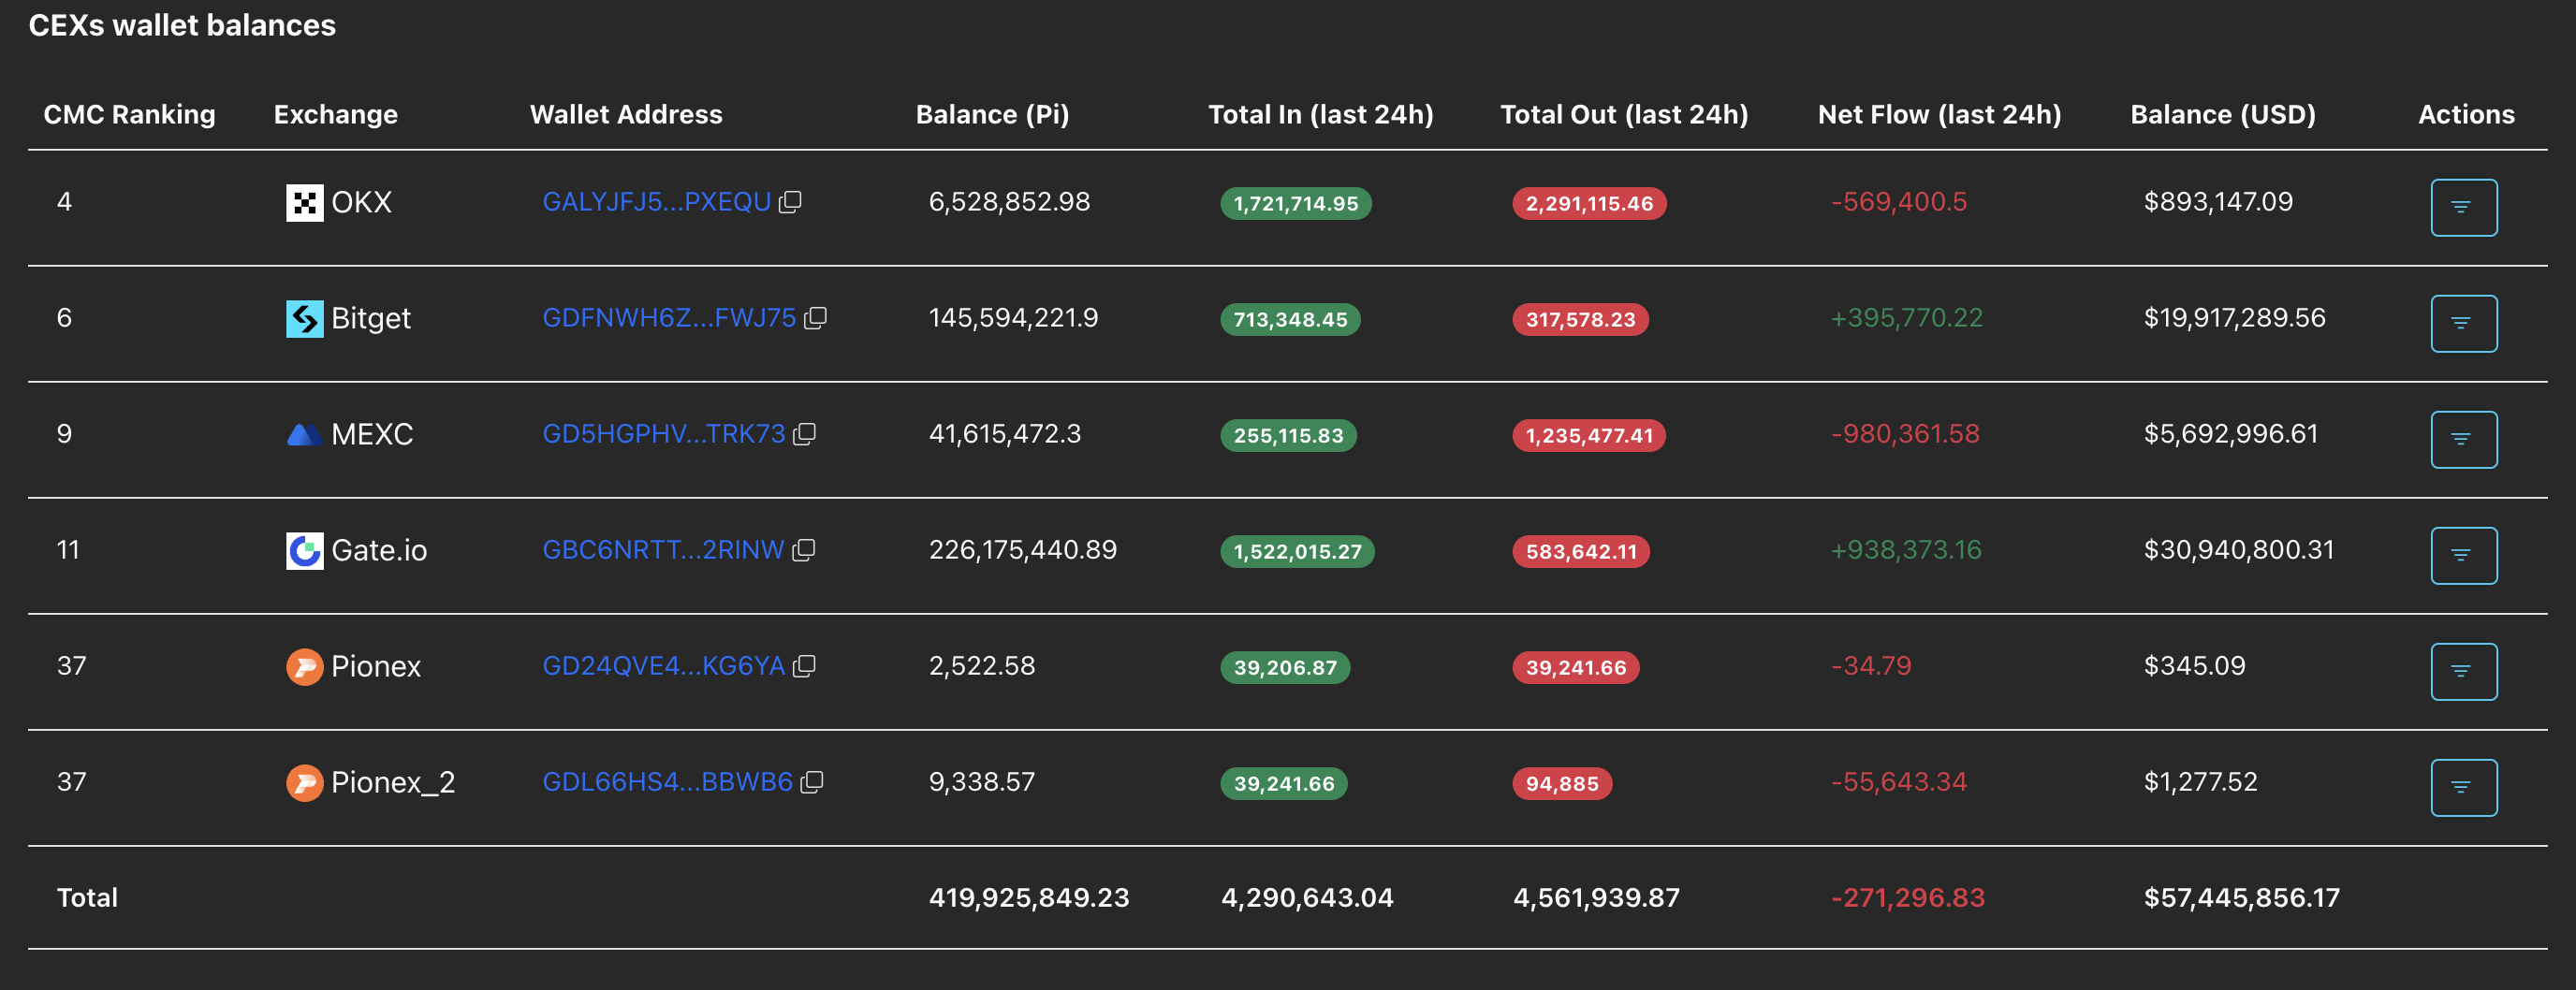
  • PI-supporting CEXs record net withdrawals over 24 hours as Pi Foundation outflows slow, suggesting increased buying pressure.
  • The technical outlook for PI highlights a potential double-bottom reversal at a crucial support level.

Pi Network (PI) is up almost 1% at press time on Friday, extending the 2% gains from the previous day. Renewed buying pressure, evidenced by increased withdrawals from exchanges supporting the PI token, and reduced outflows from the Pi Foundation, adds tailwinds. The technical outlook for PI is bullish in the short term, driven by the likelihood of a double-bottom reversal at a key support level.

On-chain data points to reduced headwinds

PI scan data shows that Centralized Exchanges (CEXs) have recorded a net outflow of 271,296 PI tokens over the last 24 hours, suggesting renewed buying pressure as investor confidence rebuilds. 

PI CEXs data. Source: PiScan

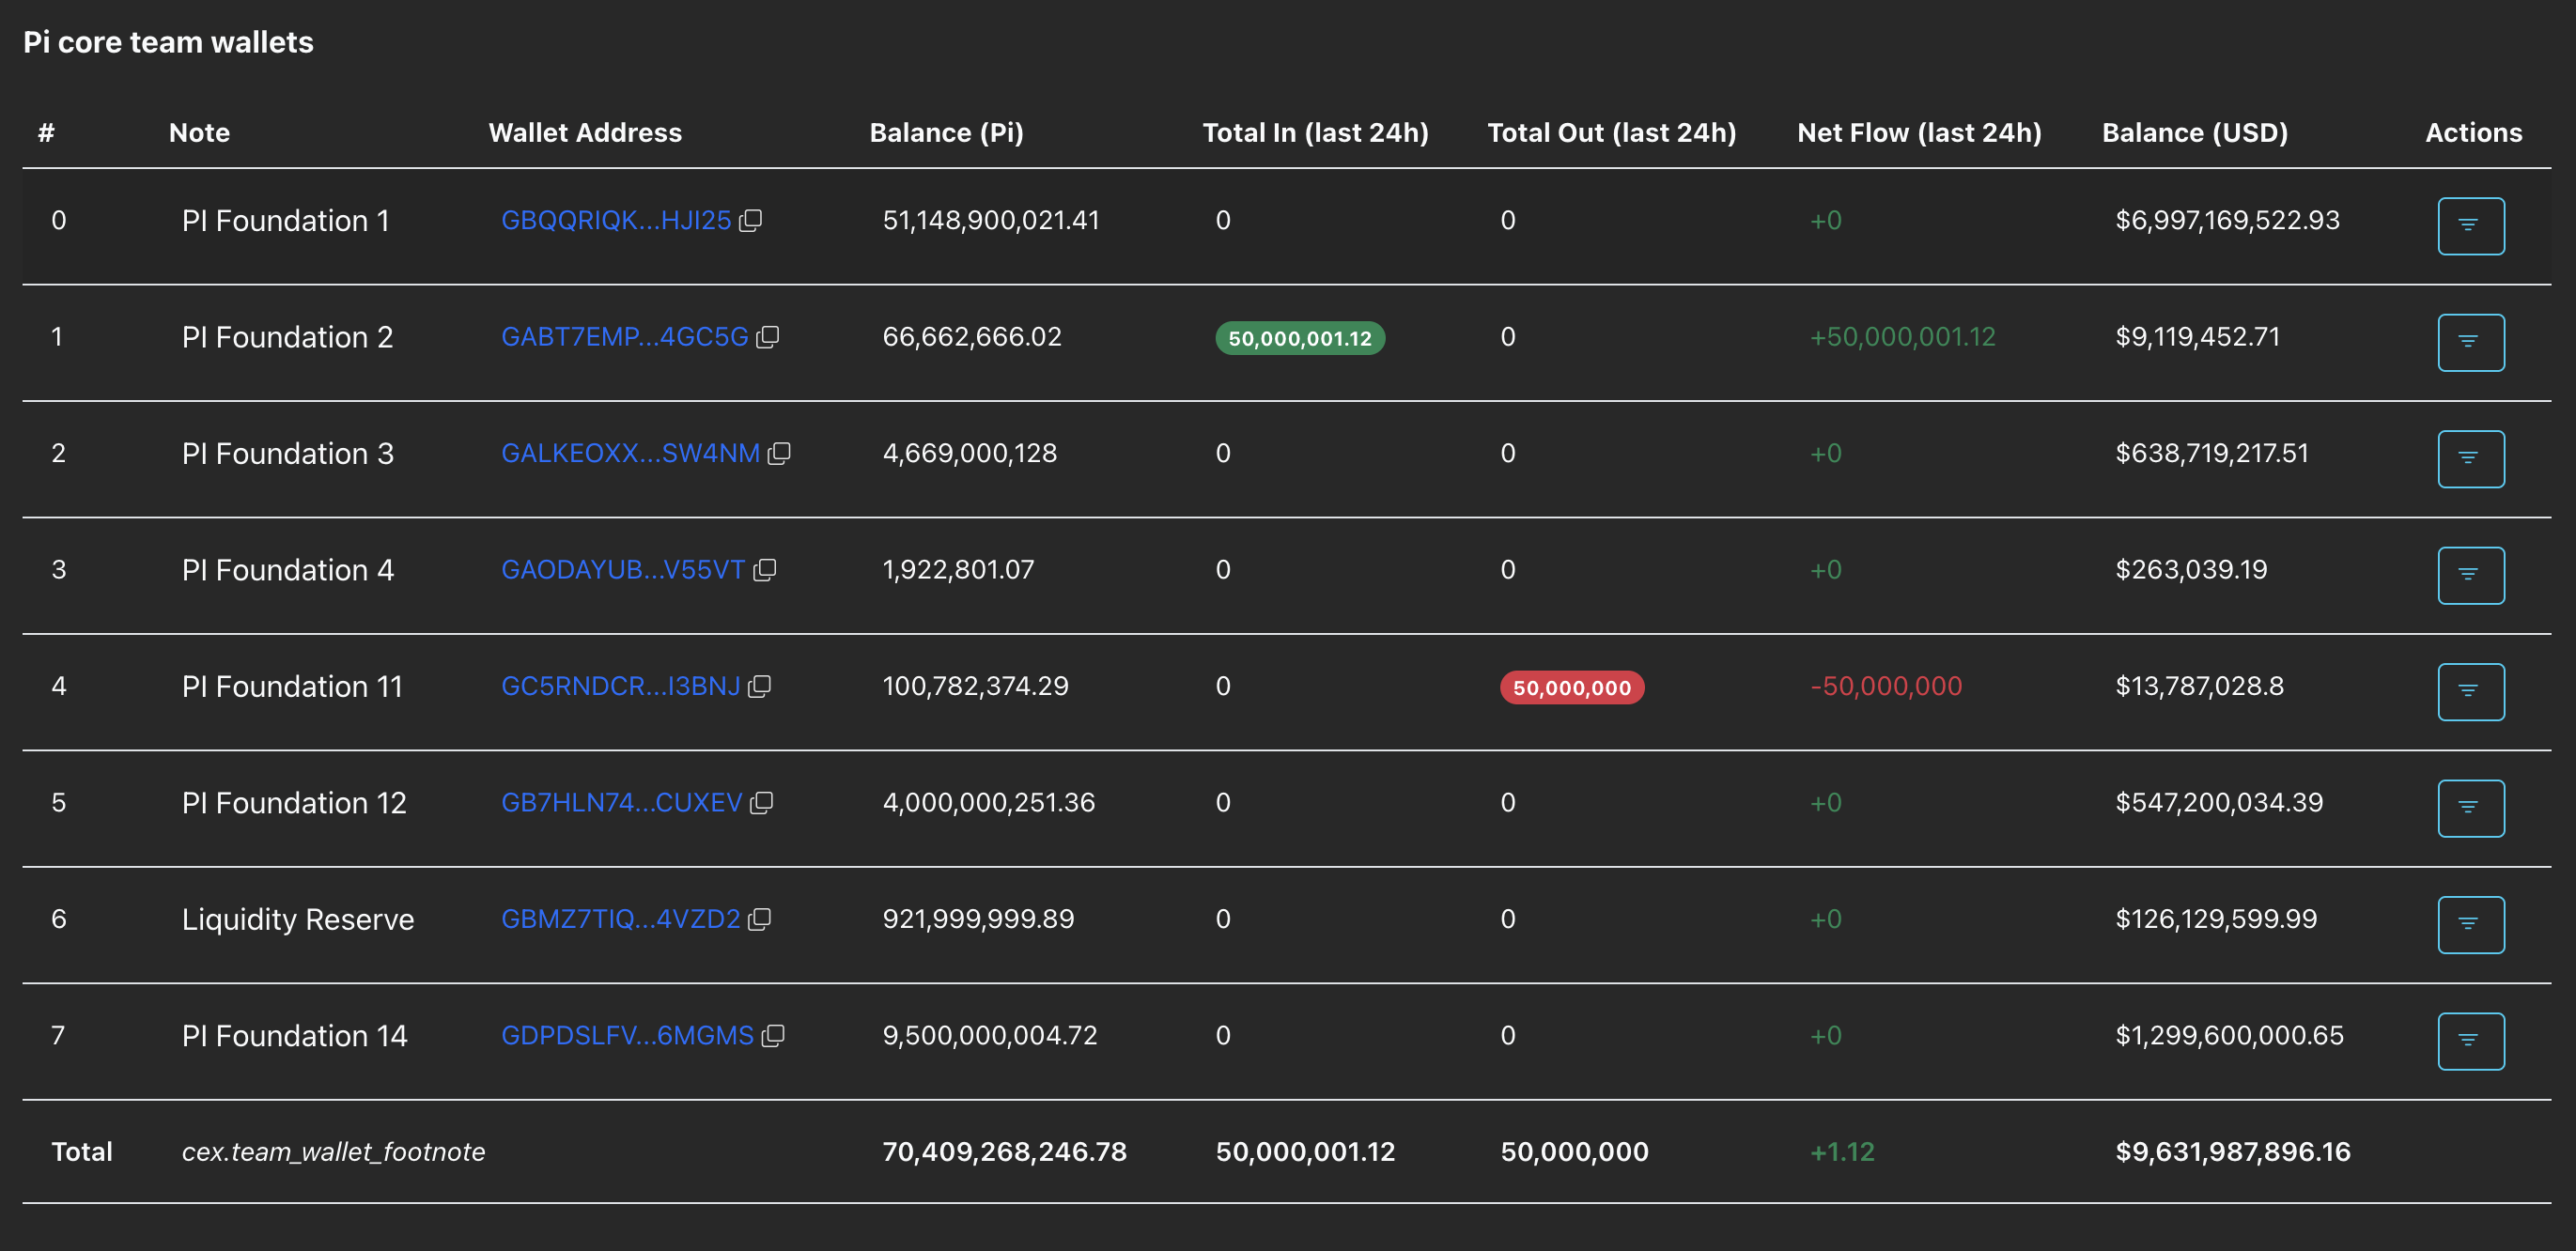
The Pi core team wallets, which have previously recorded major outflows, made a strategic shift of 50 million PI tokens, without any significant outflows in the last 24 hours. This signals reduced outflow from PI Foundation, which limits the downside pressure. If the trend continues, a limited supply dump and steady CEXs outflows could support the short-term recovery in PI token.

PI Foundation wallets data. Source: PiScan

Pi Network prepares for a rebound from key support

PI token is approaching the $0.1400 round figure after bouncing off the S1 pivot point at $0.1327 the previous day. The sudden recovery suggests a double-bottom reversal, as the support was previously tested by the February 6 low at $0.1300. 

The immediate resistance for the PI token is at $0.1533, aligning with the October 10 low. A steady close above this level could target the 50-day Exponential Moving Average at $0.1763. 

However, the downward-sloping 50- and 200-day EMAs reaffirm the prevailing bearish bias and are likely to cap gains in an extended recovery. 

The technical indicators on the daily chart back the short-term rebound thesis despite prevailing downside pressure. The Relative Strength Index (RSI) is at 26, remaining in the oversold zone and suggesting a potential rebound, typically seen at saturated levels of selling pressure. 

At the same time, the Moving Average Convergence Divergence (MACD) converges with the signal line as negative histogram bars recede, suggesting a bullish crossover as bearish momentum wanes. 

PI/USDT daily price chart.

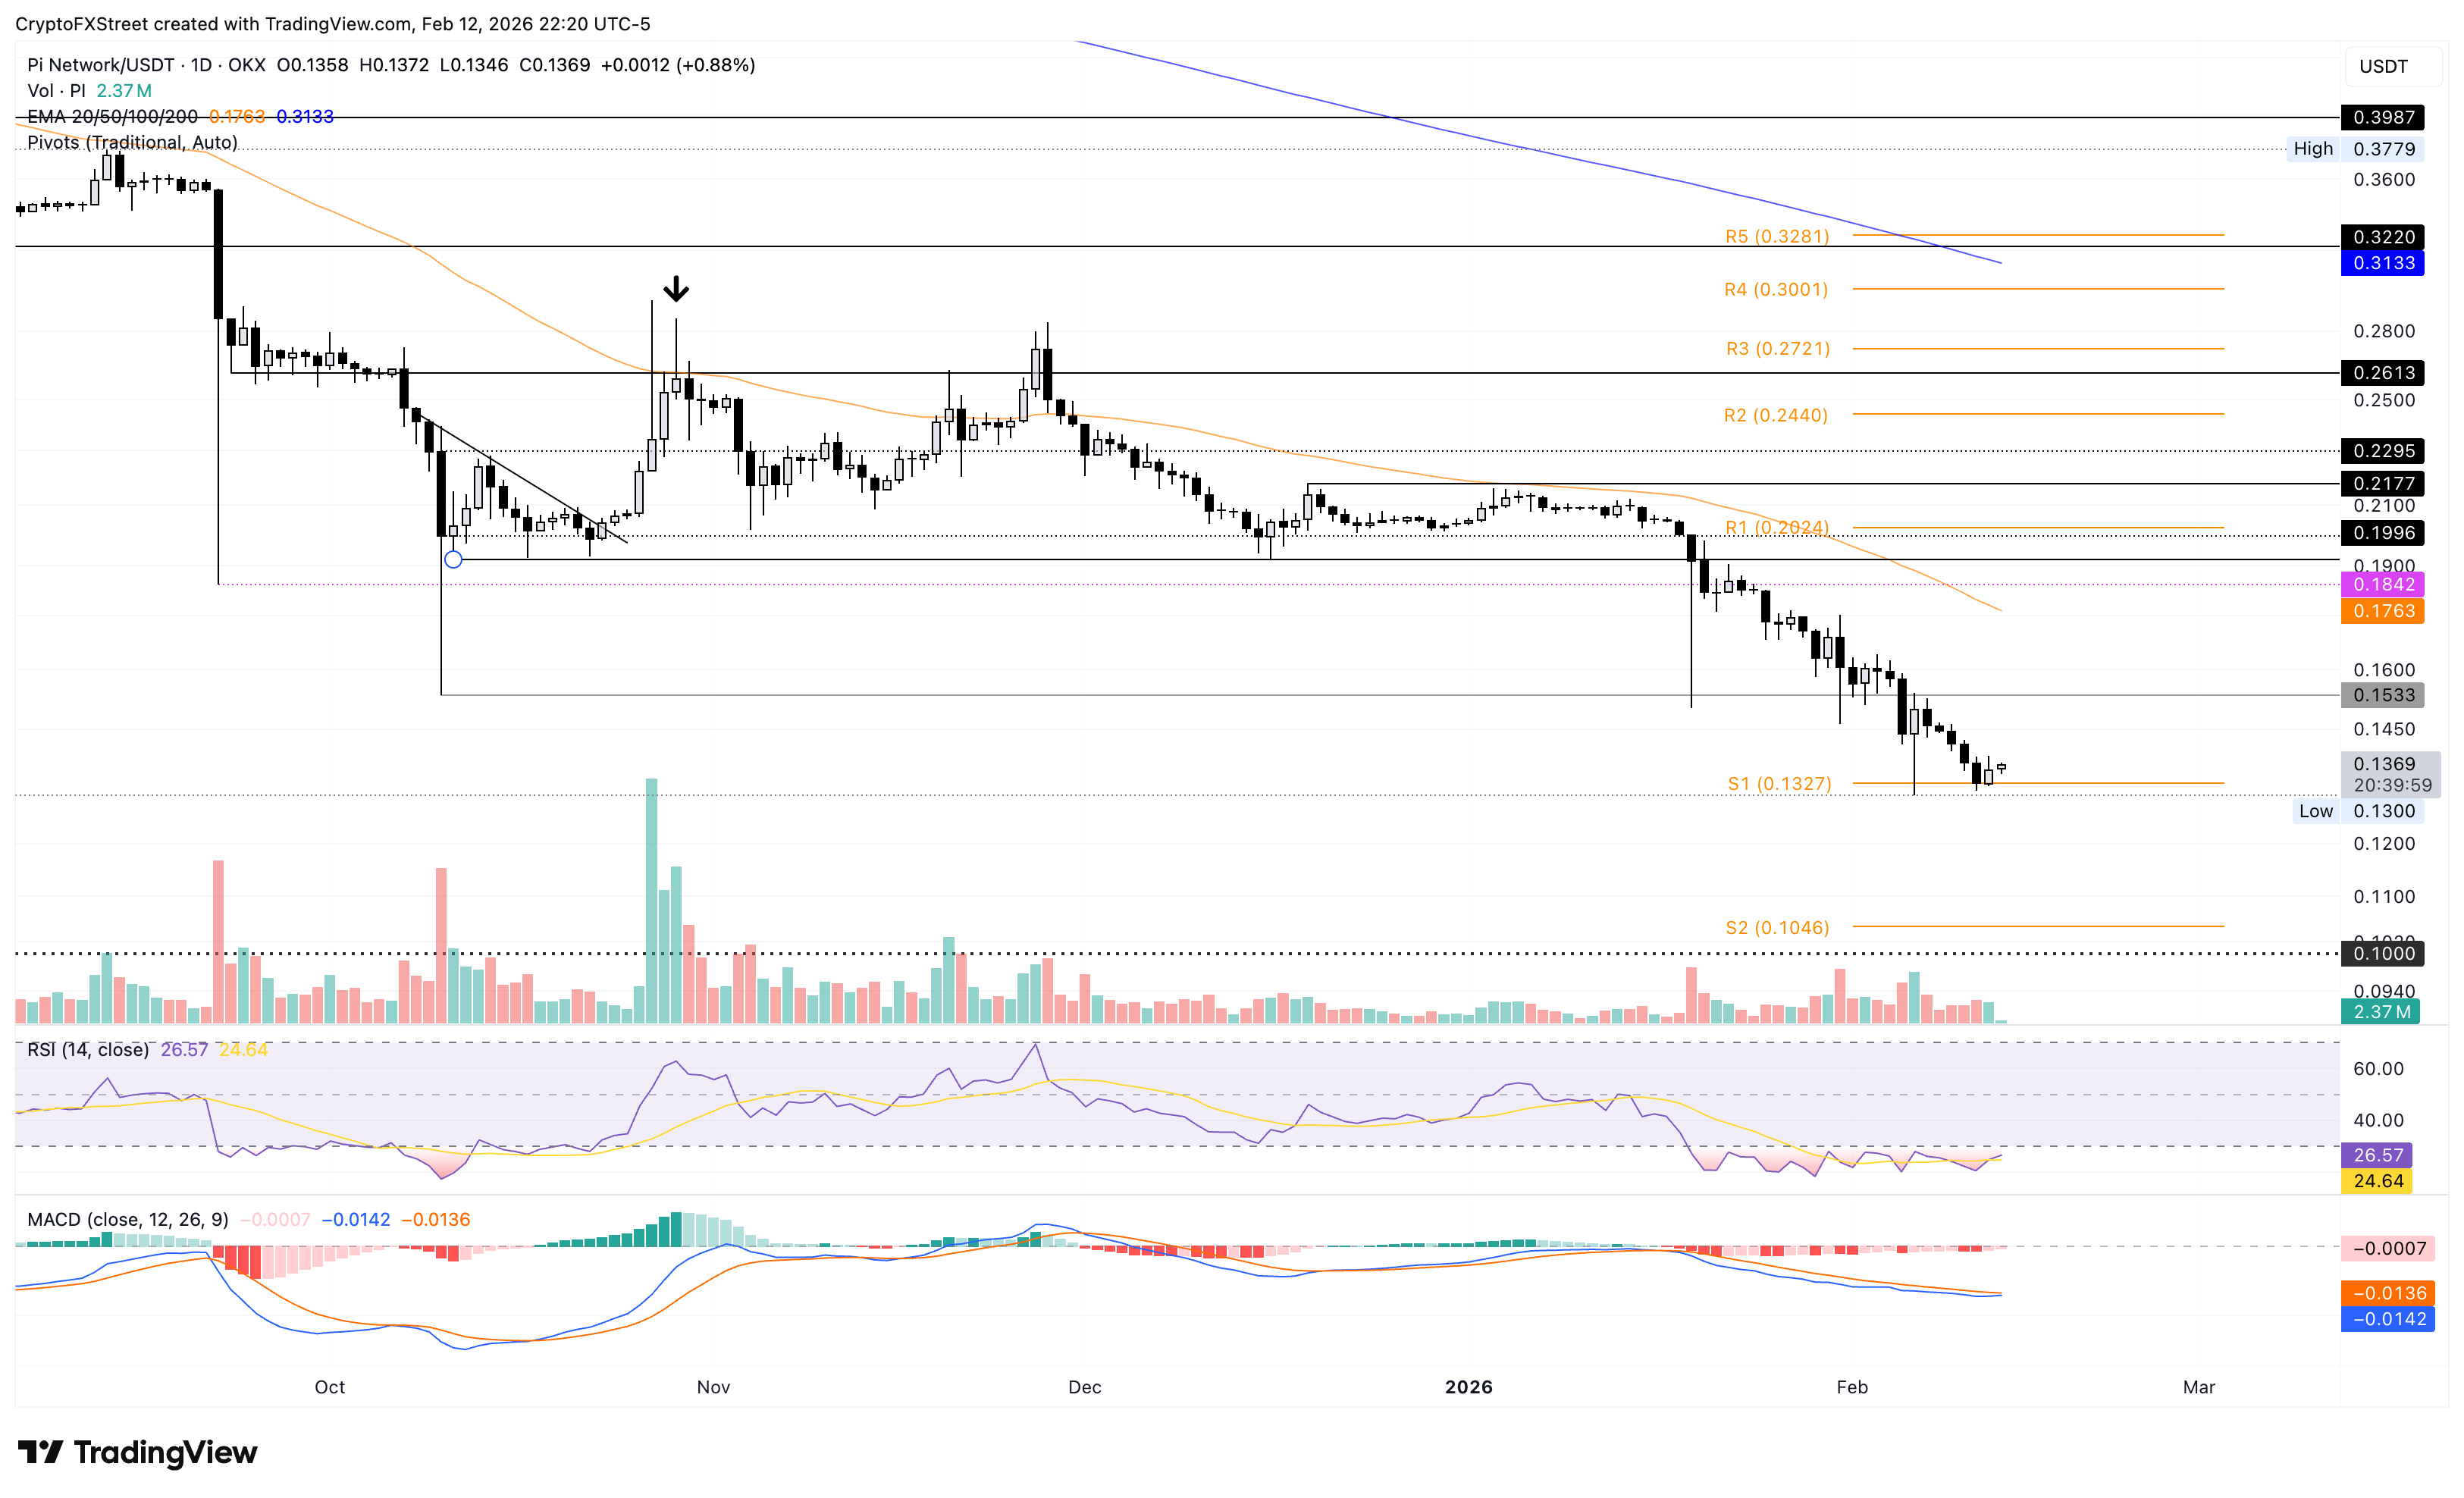
However, if the PI token slips below the S1 pivot point at $0.1327 on a daily close, it could extend the decline to the S2 pivot point at $0.1046.

Disclaimer: For information purposes only. Past performance is not indicative of future results.
placeholder
Ethereum (ETH) Price Closes Above $3,900 — Is a New All-Time High Possible Before 2024 Ends?Once again, the price of Ethereum (ETH) has risen above $3,900. This bounce has hinted at a further price increase for the altcoin before the end of the year.
Author  Beincrypto
Dec 17, 2024
Once again, the price of Ethereum (ETH) has risen above $3,900. This bounce has hinted at a further price increase for the altcoin before the end of the year.
placeholder
Markets in 2026: Will gold, Bitcoin, and the U.S. dollar make history again? — These are how leading institutions thinkAfter a turbulent 2025, what lies ahead for commodities, forex, and cryptocurrency markets in 2026?
Author  Insights
Dec 25, 2025
After a turbulent 2025, what lies ahead for commodities, forex, and cryptocurrency markets in 2026?
placeholder
Gold Price Forecast: XAU/USD falls below $5,050 as traders await US jobs data Gold price (XAU/USD) attracts some sellers near $5,035 during the early Asian session on Tuesday. The precious metal edges lower amid improved risk sentiment and some profit-taking. Traders brace for key US economic data later this week, including delayed employment and inflation reports. 
Author  FXStreet
Feb 10, Tue
Gold price (XAU/USD) attracts some sellers near $5,035 during the early Asian session on Tuesday. The precious metal edges lower amid improved risk sentiment and some profit-taking. Traders brace for key US economic data later this week, including delayed employment and inflation reports. 
placeholder
Gold climbs to $5,050 as Fed-driven USD weakness offsets positive risk tone ahead of US NFPGold (XAU/USD) attracts some dip-buyers following the previous day's modest slide and climbs back above the $5,050 level during the Asian session on Wednesday.
Author  FXStreet
Feb 11, Wed
Gold (XAU/USD) attracts some dip-buyers following the previous day's modest slide and climbs back above the $5,050 level during the Asian session on Wednesday.
placeholder
Financial Markets 2026: Volatility Catalysts in Gold, Silver, Oil, and Blue-Chip Stocks—A CFD Trader's OutlookThe financial world is perpetually in motion, but the landscape for 2026 seems to be shaping up to be particularly dynamic. For CFD traders navigating global markets, this heightened volatility could present a distinctive set of challenges and opportunities.
Author  Rachel Weiss
Yesterday 05: 31
The financial world is perpetually in motion, but the landscape for 2026 seems to be shaping up to be particularly dynamic. For CFD traders navigating global markets, this heightened volatility could present a distinctive set of challenges and opportunities.
goTop
quote