

The Machines Know: Bitcoin Primed For Epic Price Surge To $77,000
The cryptocurrency world is abuzz with speculation after a deep learning model projected a dramatic price increase for Bitcoin (BTC) within the next month. However, despite the AI’s bullish outlook, financial experts urge investors to approach the prediction with a healthy dose of skepticism.
Bitcoin Price Stagnant, But AI Model Foresees Bright Future
For the past week, Bitcoin has been stuck in a holding pattern, hovering stubbornly around the $64,000 mark. This lack of volatility has left many investors scratching their heads, unsure of the market’s next move. But a deep learning model developed by CryptoQuant, a leading blockchain analytics platform, has thrown a curveball into the mix.
The model, trained on a massive dataset of historical price movements and on-chain activity, predicts a significant price surge for Bitcoin in the coming weeks. According to the analysis, Bitcoin could break past the $77,000 barrier within the next 30 days, marking a new all-time high (ATH).
Bullish Metrics Support AI’s Vision
While the AI’s prediction is certainly eye-catching, some analysts are taking a wait-and-see approach. They point to several bullish metrics that seem to align with the model’s forecast. The network-to-value (NVT) ratio, a metric used to gauge an asset’s relative valuation, has dipped significantly, suggesting Bitcoin might be undervalued.
Additionally, exchange reserves have been dropping, indicating a decrease in selling pressure. These factors, coupled with the model’s prediction, paint a potentially optimistic picture for Bitcoin’s immediate future.
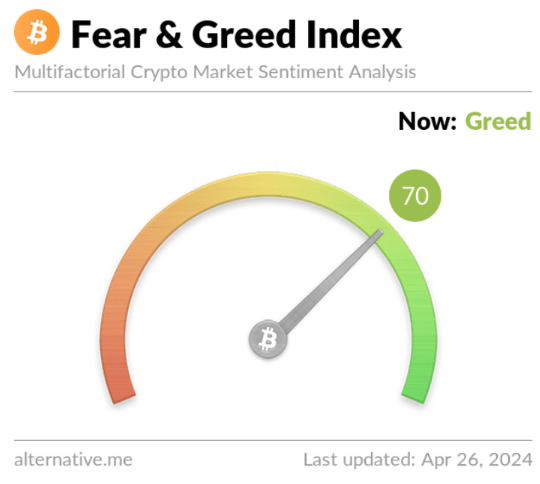
However, a lurking shadow of uncertainty remains. The Fear and Greed Index, a measure of investor sentiment in the cryptocurrency market, currently sits firmly in “greed” territory. Historically, periods of extreme greed have often been followed by market corrections.
This raises concerns that the current price stagnation might not be a prelude to a surge, but rather a sign of an overheated market ripe for a pullback.
Technical analysis of Bitcoin’s daily chart reveals further complexities. The price has repeatedly failed to breach its 20-day Simple Moving Average (SMA), a key indicator of short-term momentum.
Both the Chaikin Money Flow (CMF) and Relative Strength Index (RSI) are hovering sideways, suggesting a lack of clear direction in the market. These indicators imply that investors might be in for a few more days of sluggish price movement before a potential breakout, either upwards or downwards, occurs.
A Calculated GambleThe deep learning model’s prediction offers a glimmer of hope for Bitcoin bulls, but it’s crucial to remember that AI forecasts are not infallible. The confluence of bullish metrics certainly adds weight to the model’s argument, but the ever-present risk of a market correction fueled by greed cannot be ignored.
Featured image from Pixabay, chart from TradingView
Recommended Articles


