


HBAR Price Faces 30% Risk as TVL-Led Slump Deepens Without ETF Support
HBAR price remains under heavy pressure as the broader crypto market stays weak. The token is down nearly 47% over the past three months and has slipped another 6% in the past 24 hours, tracking Bitcoin’s latest decline. More importantly, this is not just a short-term sell-off. Hedera’s price has been falling steadily since September, losing almost 67% from its highs.
Behind this move is a deeper problem: shrinking network liquidity, weak institutional demand, and fading retail participation. As TVL continues to fall and ETF inflows remain absent, charts now suggest that HBAR could face another major downside leg. Here is what the data is showing.
Hedera’s TVL Collapse Shows Liquidity Has Been Leaving for Months
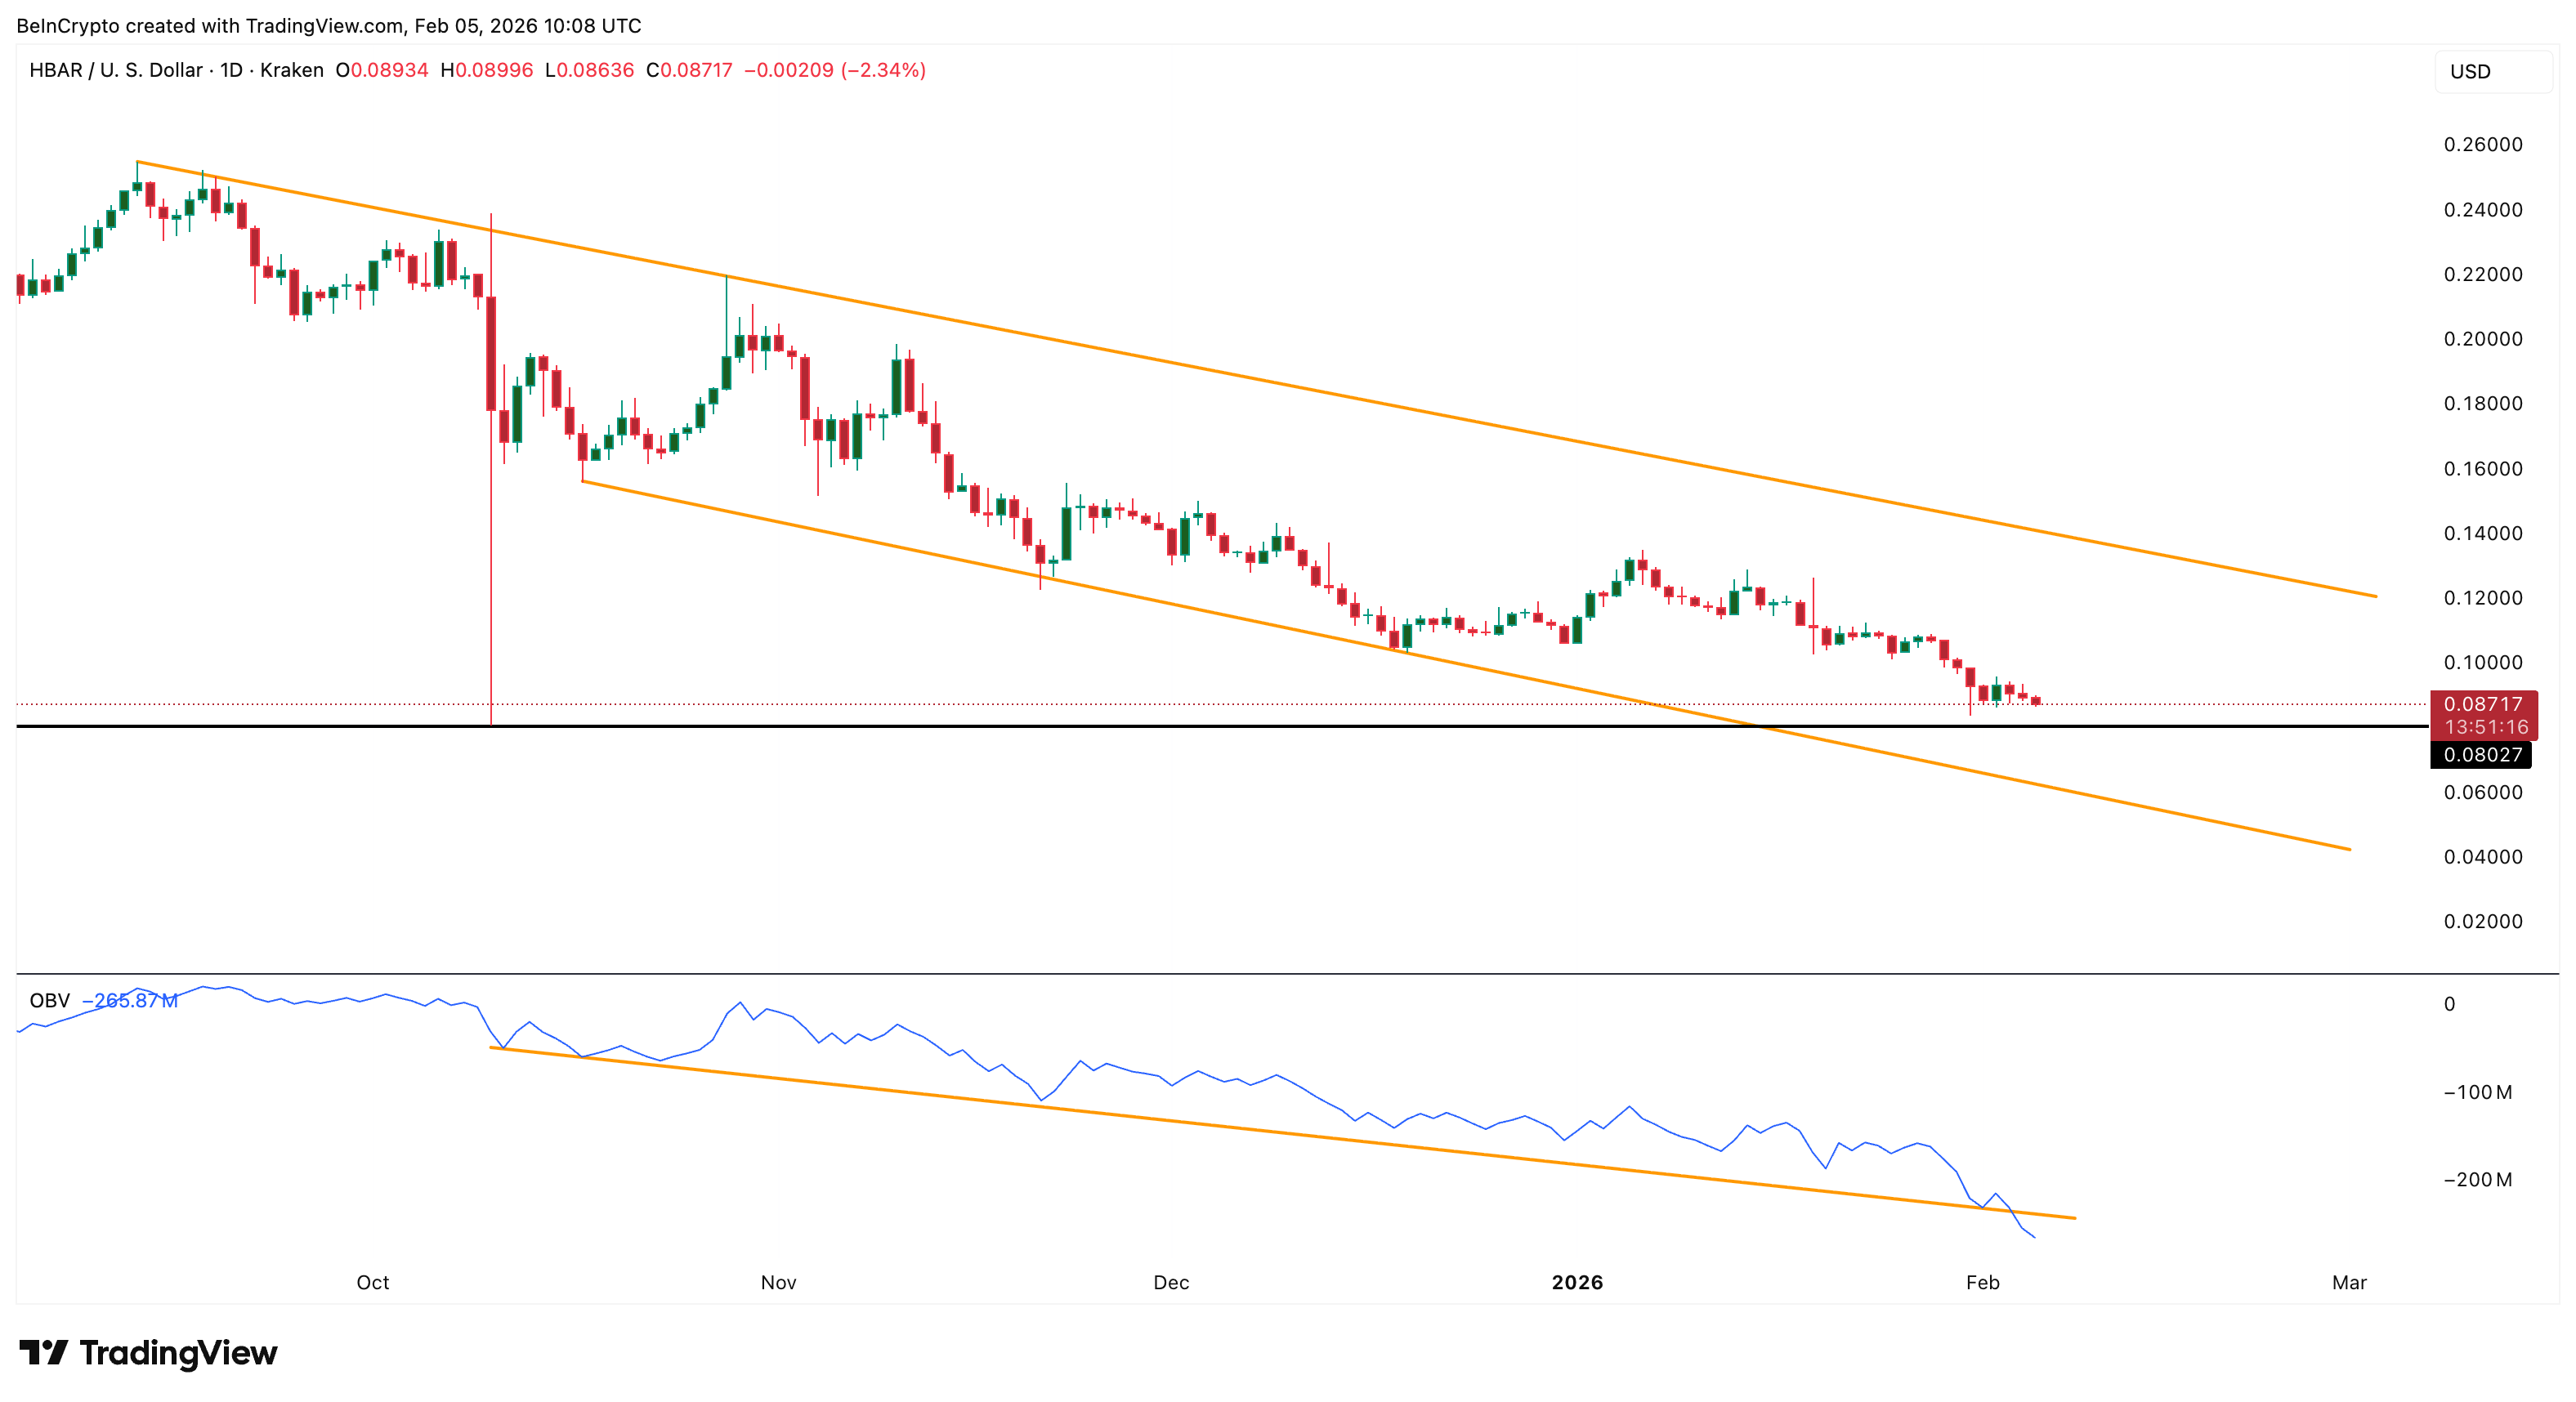
HBAR’s downtrend began in mid-September, when the price started trading against a falling trendline. Soon, the weakening prices entered a falling channel as lower highs met lower lows. Since then, every rally has been weaker, and each breakdown has pushed the token lower.
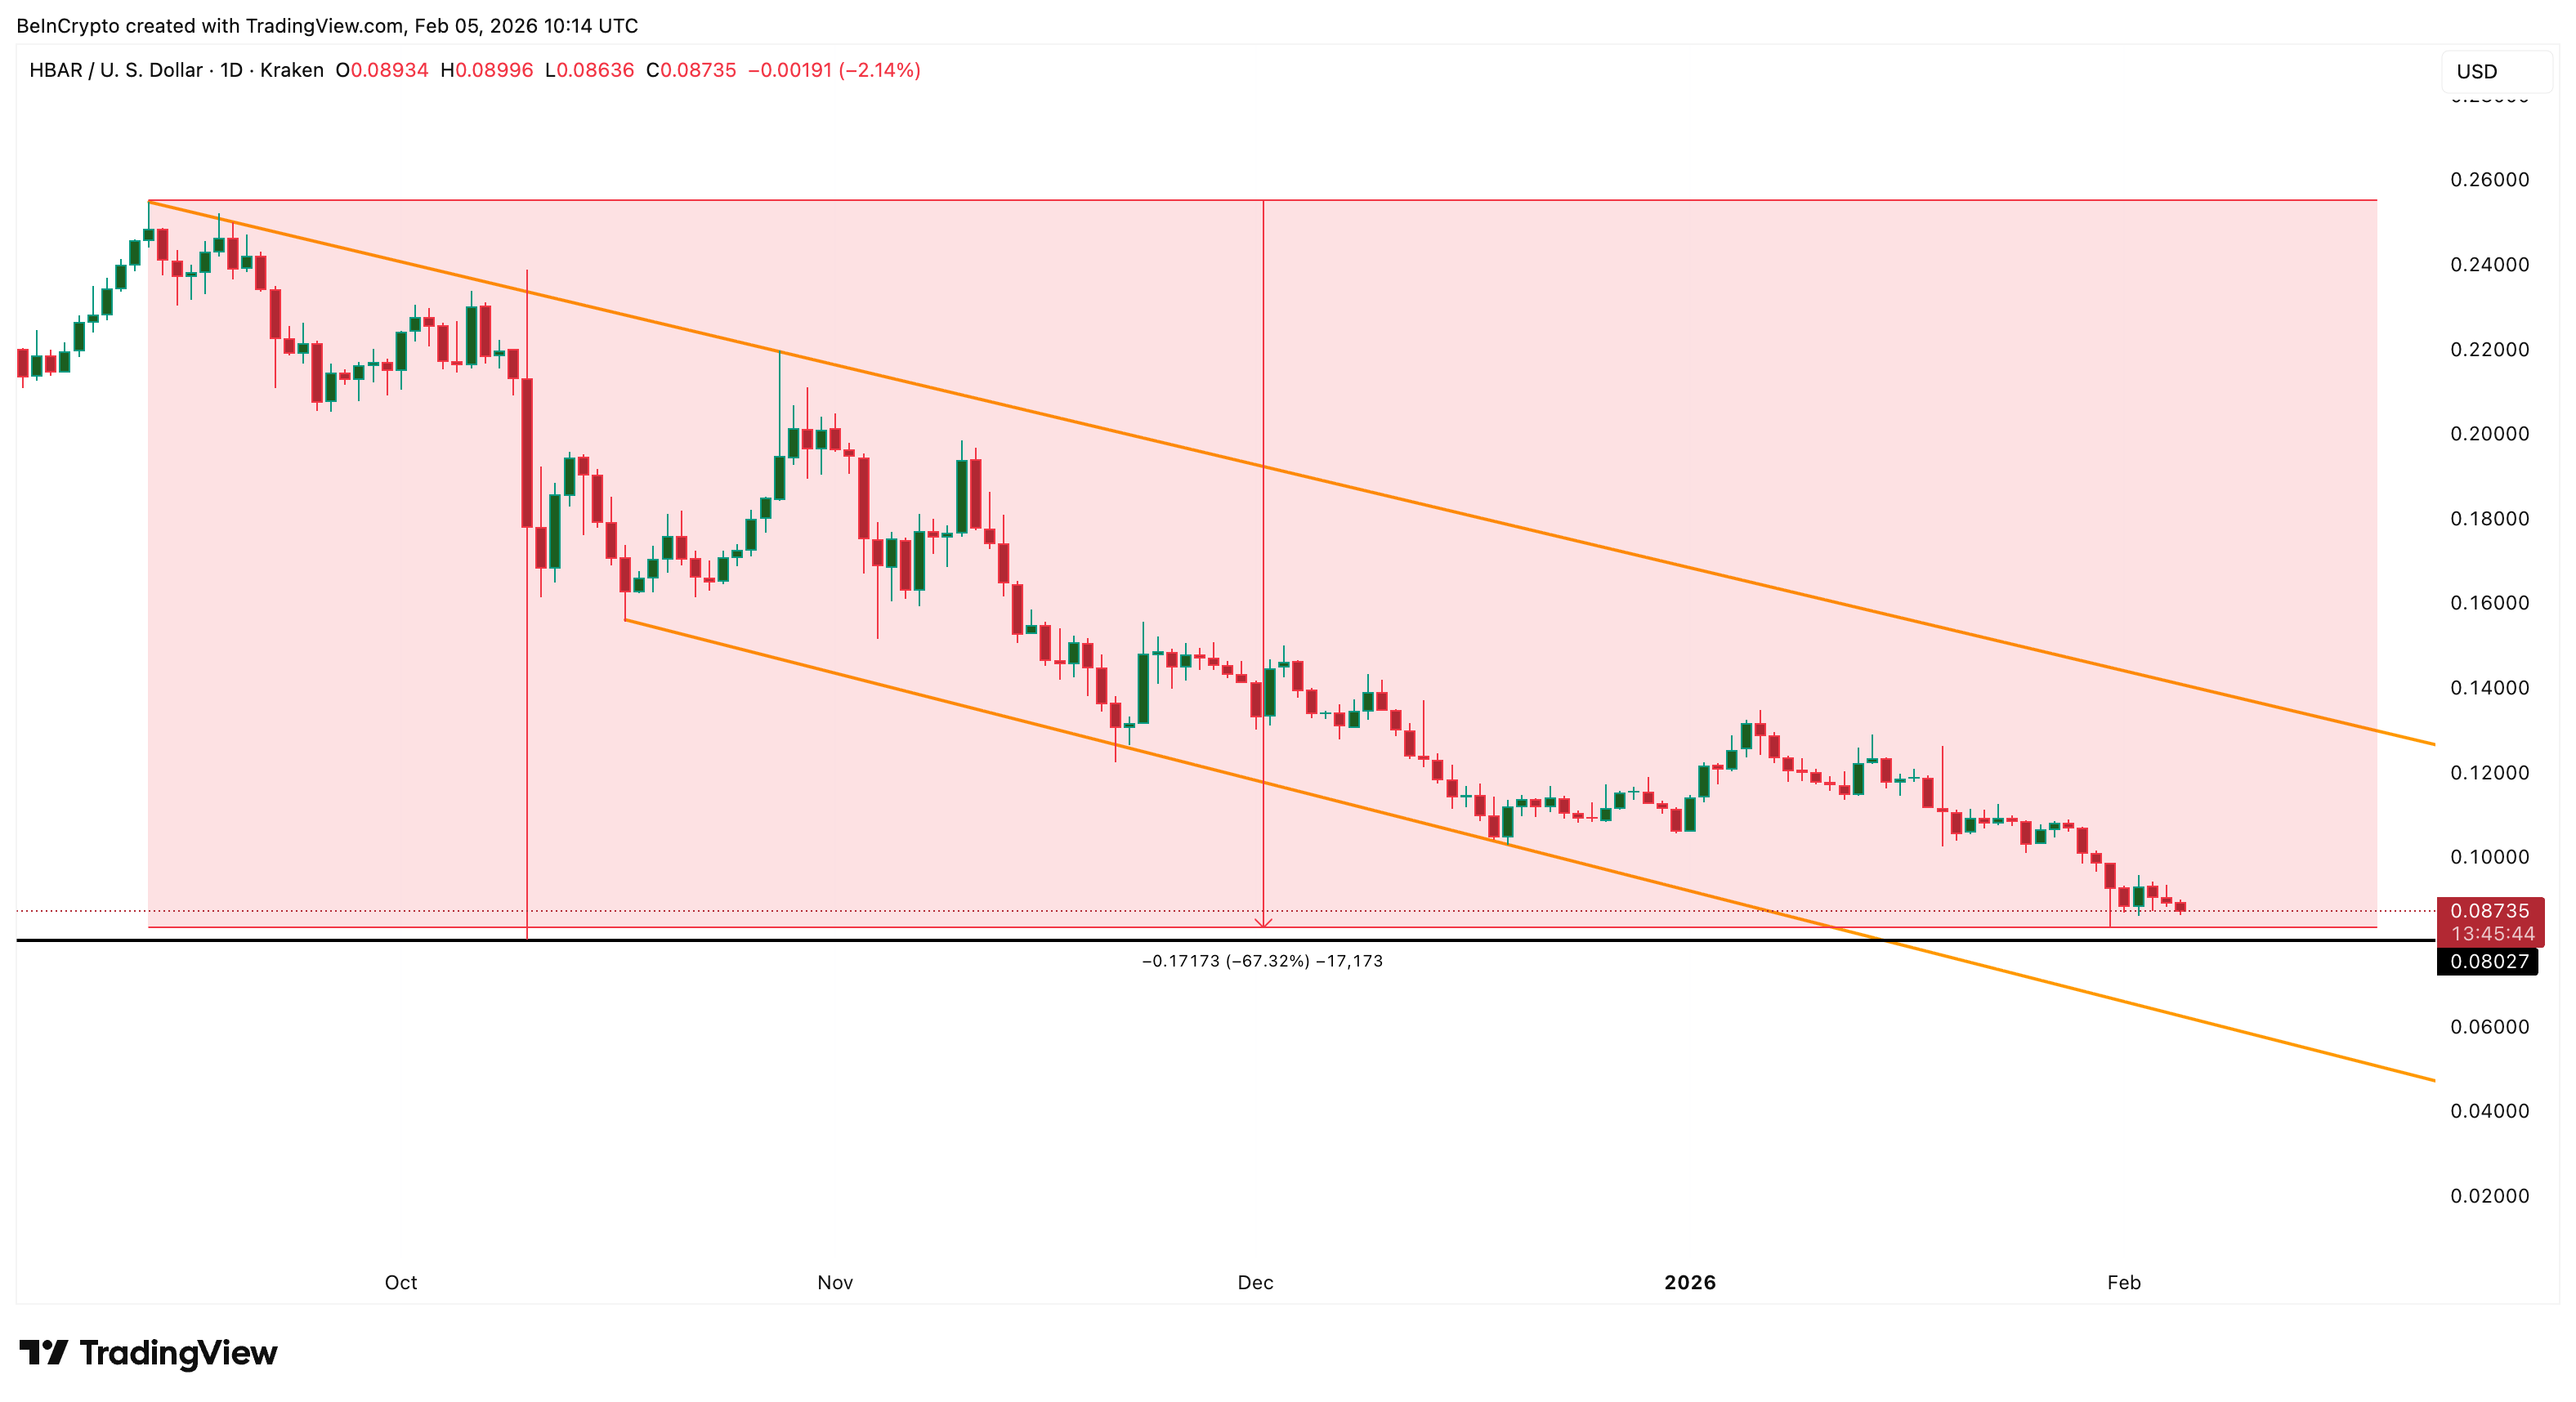 HBAR Price Weakens: TradingView
Want more token insights like this? Sign up for Editor Harsh Notariya’s Daily Crypto Newsletter here.
This HBAR price action mirrors what happened to Hedera’s on-chain liquidity.
Total value locked was near $122.5 million in September. It has now dropped to around $56 million, a decline of more than 50%. TVL measures how much capital is locked inside DeFi protocols. When TVL falls, it usually means users are withdrawing funds and activity is slowing.
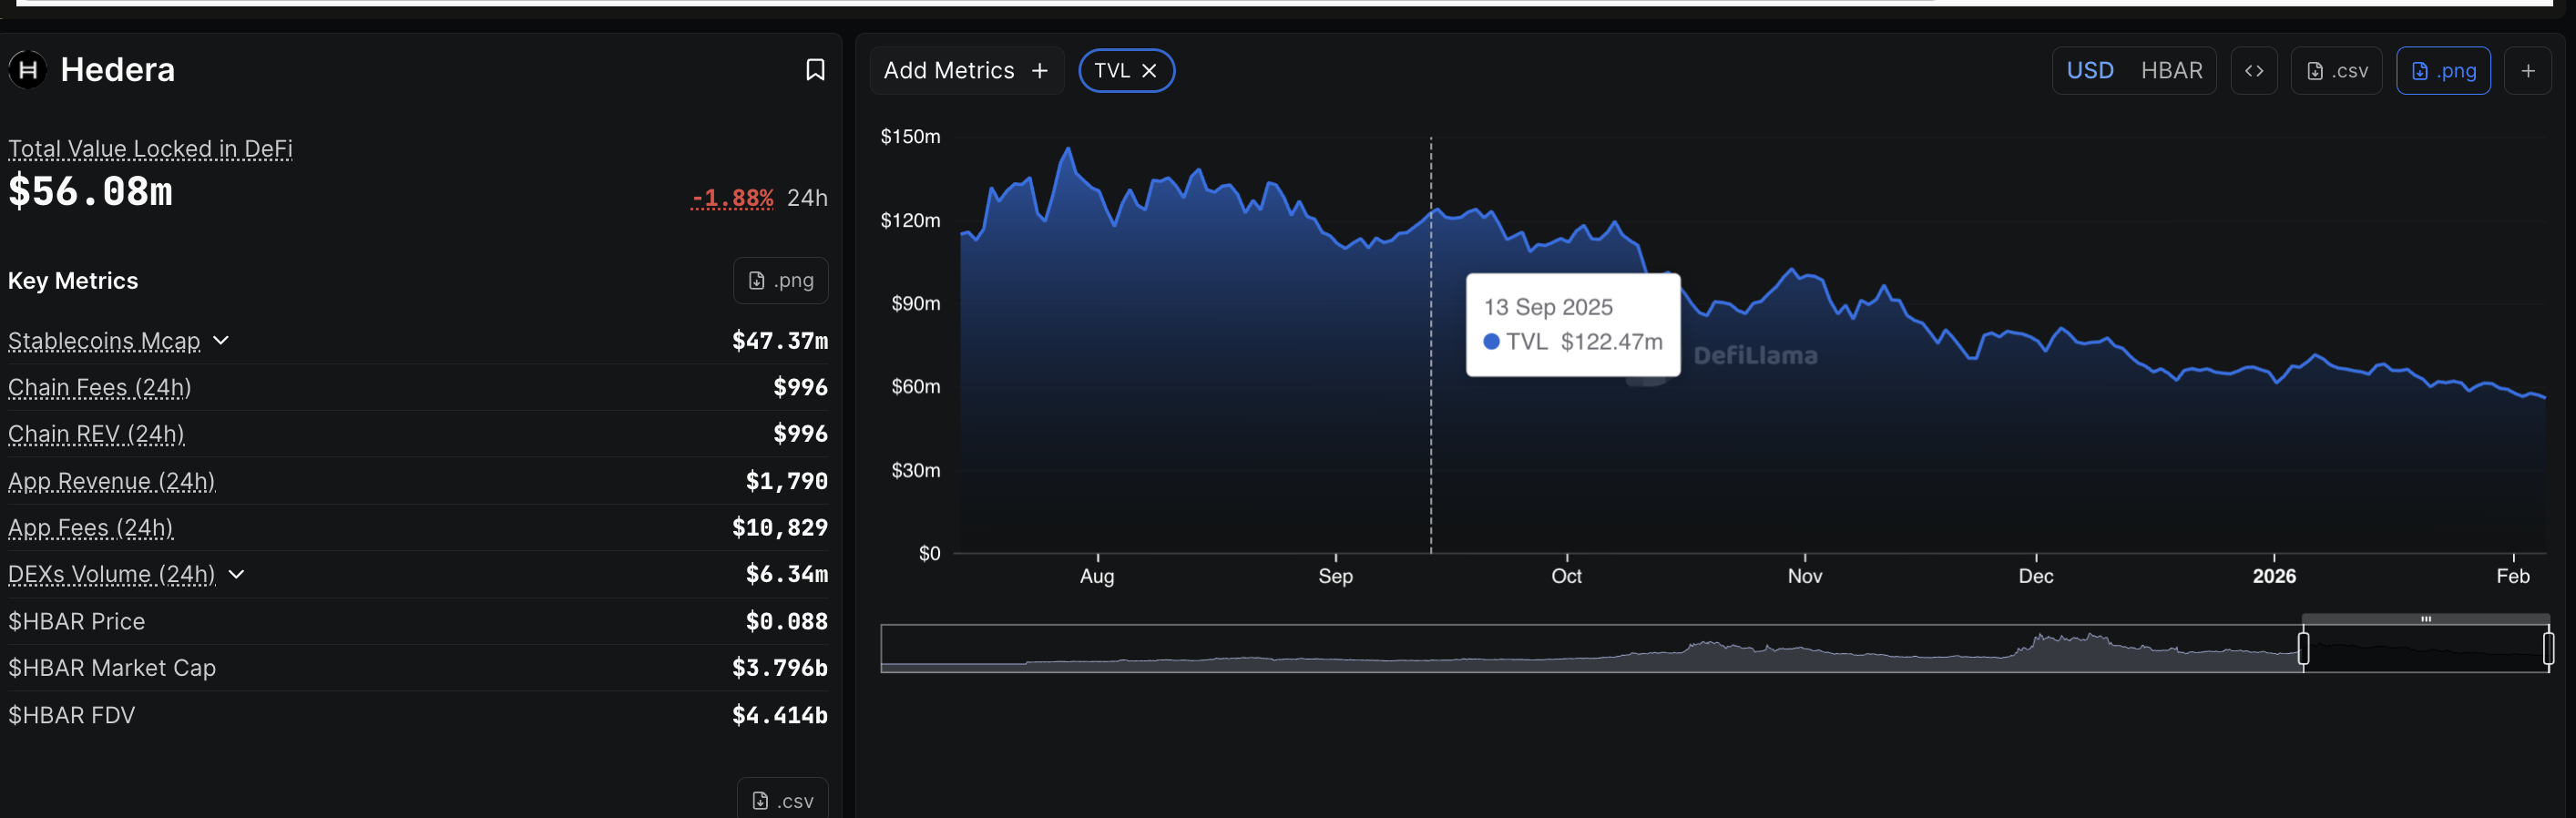 TVL Degrowth: Defillama
In simple terms, money started leaving the network months ago. The price just followed this fundamental weakness. This explains why HBAR’s decline looks gradual rather than sudden. Liquidity has been drying up steadily. Without fresh capital, rallies fail quickly.
As long as TVL stays weak, HBAR’s upside remains structurally limited.
CMF Shows Selective Buying, But ETF and Retail Demand Remain Weak
Not all signals are bearish.
The Chaikin Money Flow has been rising since mid-December, even as the price moved lower. This creates a bullish divergence, showing that some larger investors are accumulating. However, CMF is still below zero. Outflows still dominate. Inflows are improving, but not strongly enough.
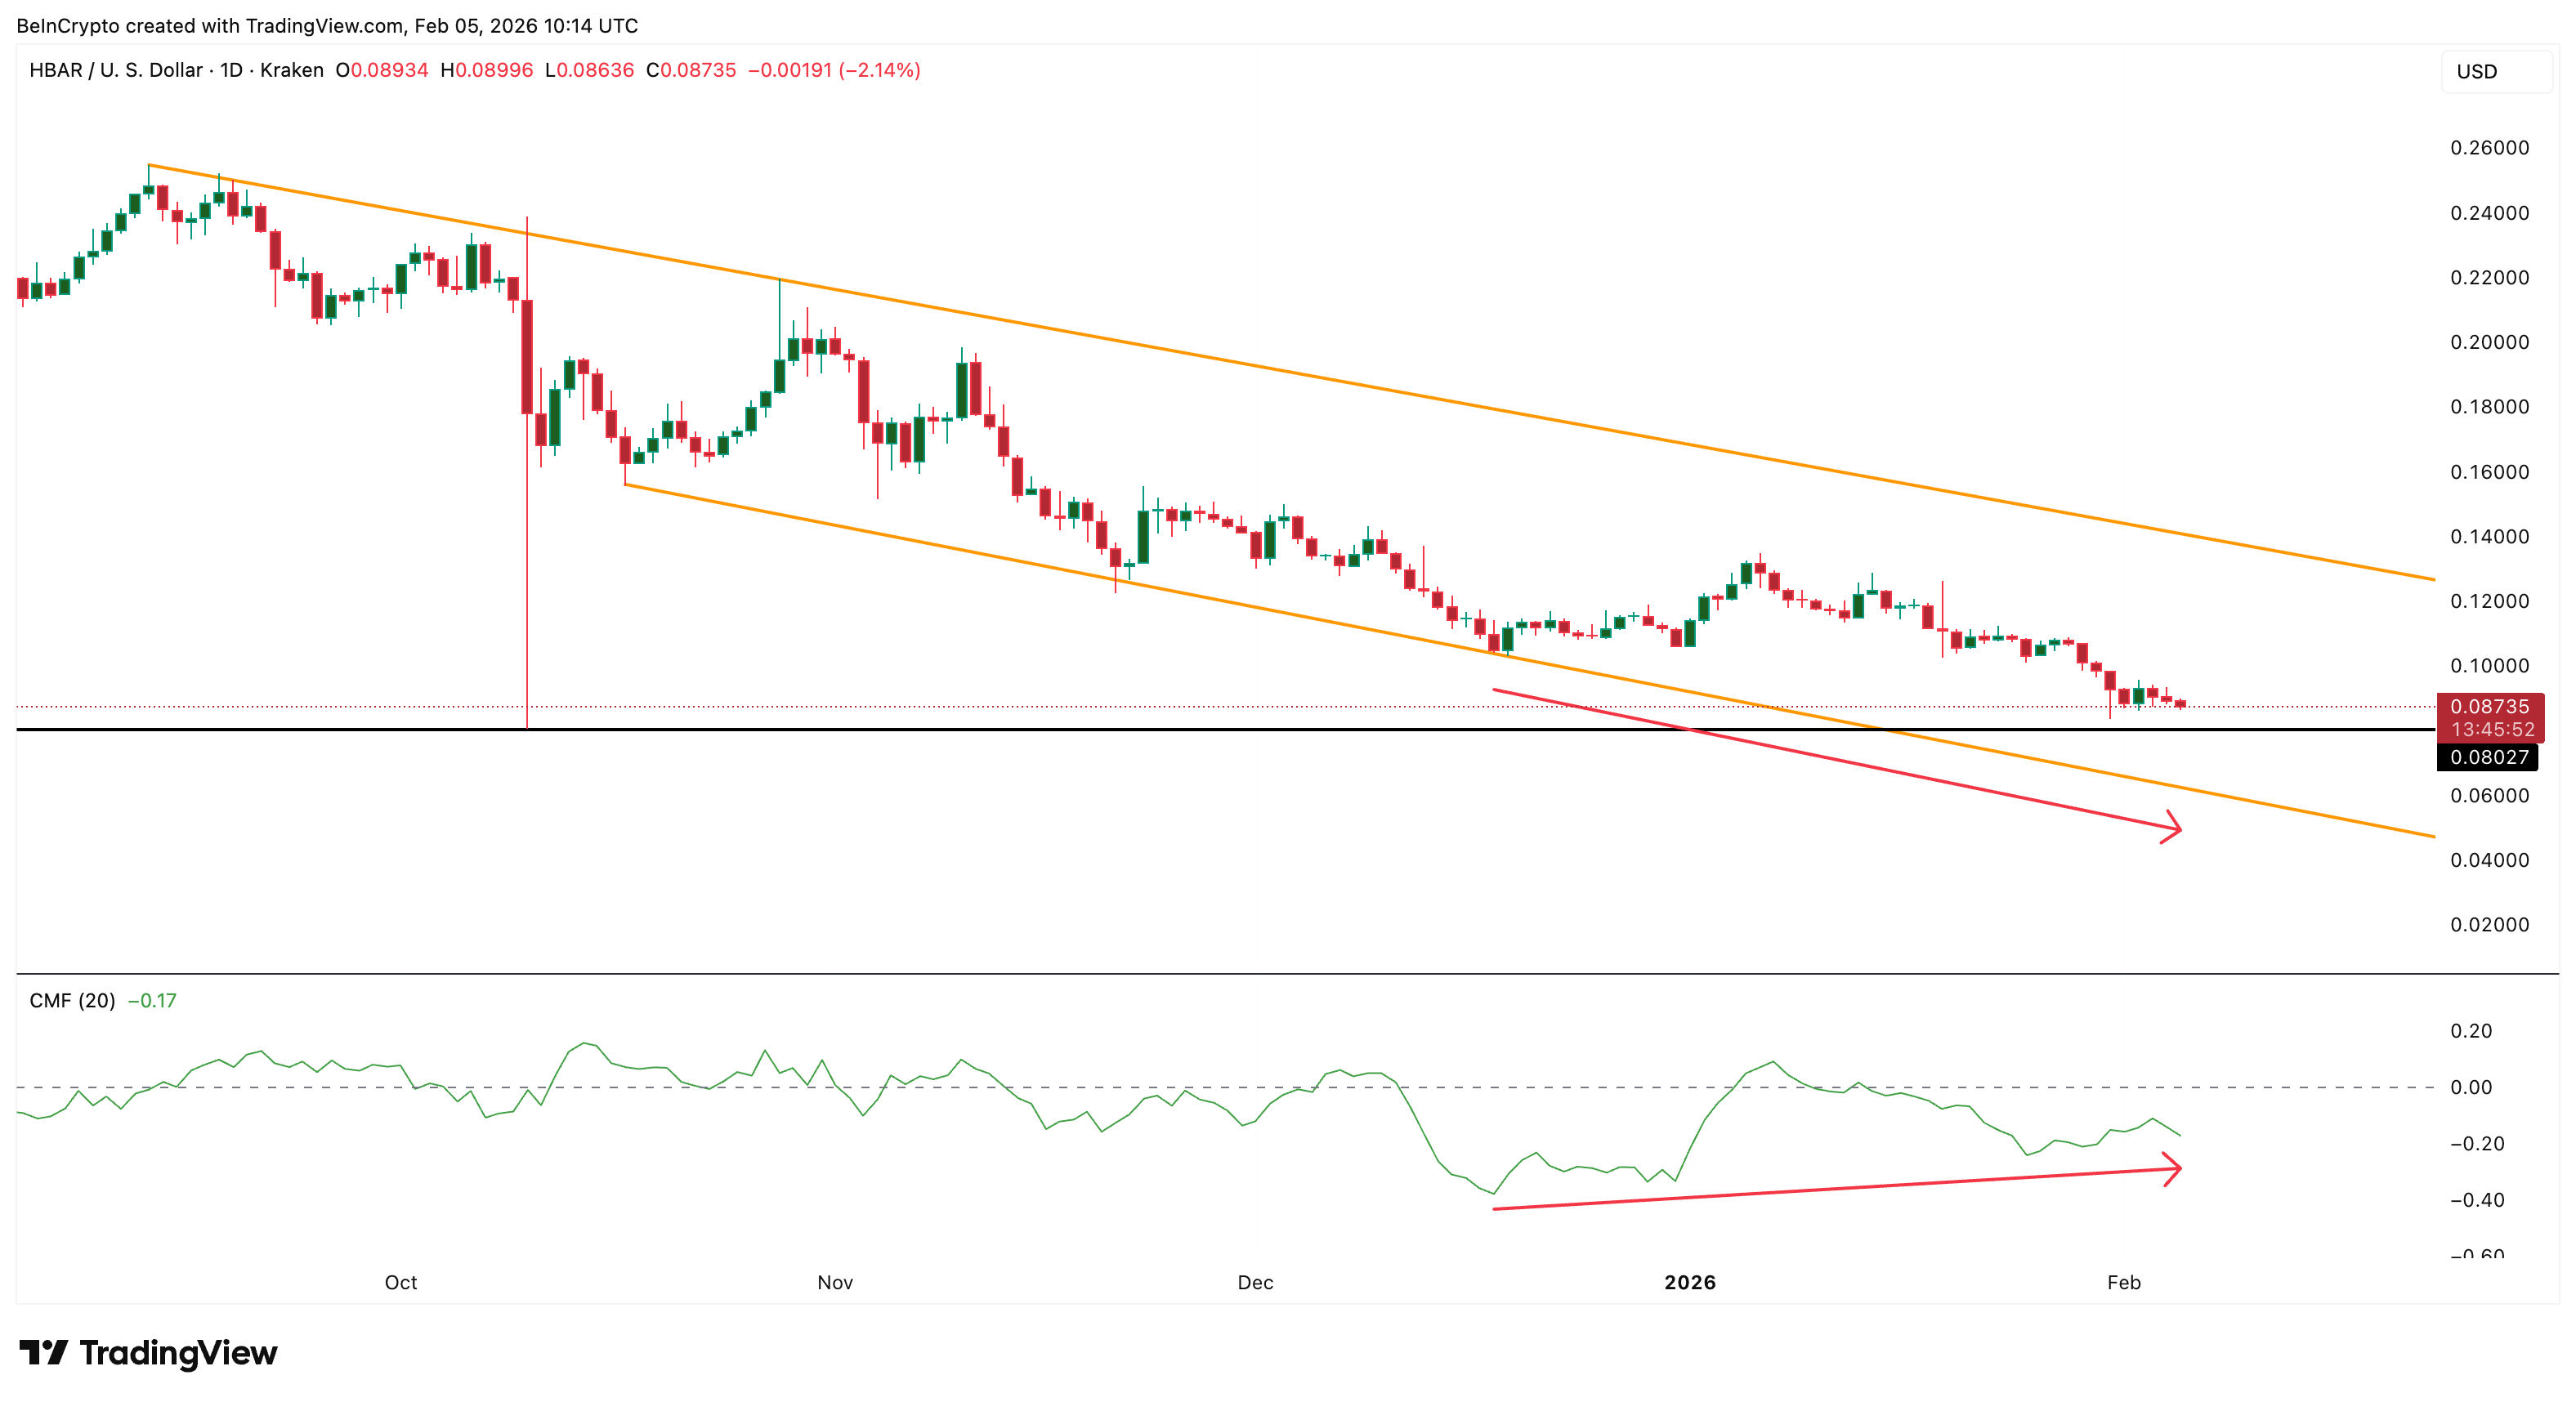 Capital Flows Survive The Dip: TradingView
At the same time, spot HBAR ETFs have shown no recent inflows over the past two weeks. ETFs bring institutional capital and could help CMF move above the zero line. Their absence limits upside momentum.
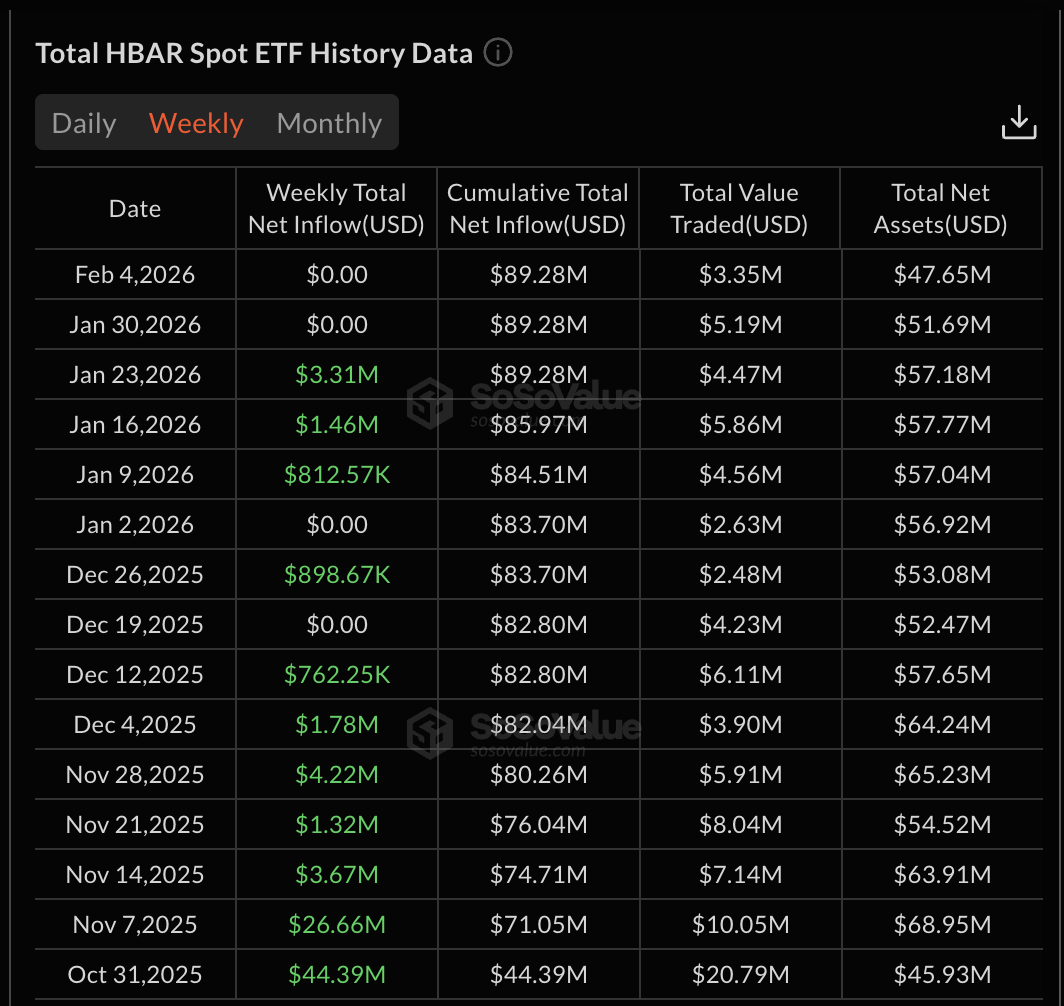 HBAR ETFs: SoSo Value
The bigger warning comes from On-Balance Volume. OBV has been trending lower since October. This showed that participation and conviction were steadily weakening even during short-term bounces. Recently, OBV broke below this descending support line.
When OBV loses long-term support, it signals that selling pressure is accelerating and that market participation is deteriorating. It suggests that fewer buyers are stepping in, even at lower prices.
 Retail Conviction Breaks Down: TradingView
So the current setup looks like this:
- Some large buyers are accumulating slowly (CMF divergence)
- Institutional flows remain weak (ETF inactivity)
- Broader participation is shrinking (OBV breakdown)
Without strong volume support, rallies lack follow-through. This explains why HBAR continues to fail at resistance despite occasional inflow signals.
Until OBV stabilizes and ETF demand improves, upside moves are likely to remain fragile.
Falling Channel and OBV Breakdown Point to a 30% Risk Zone
The Hedera Price structure confirms this fragile setup.
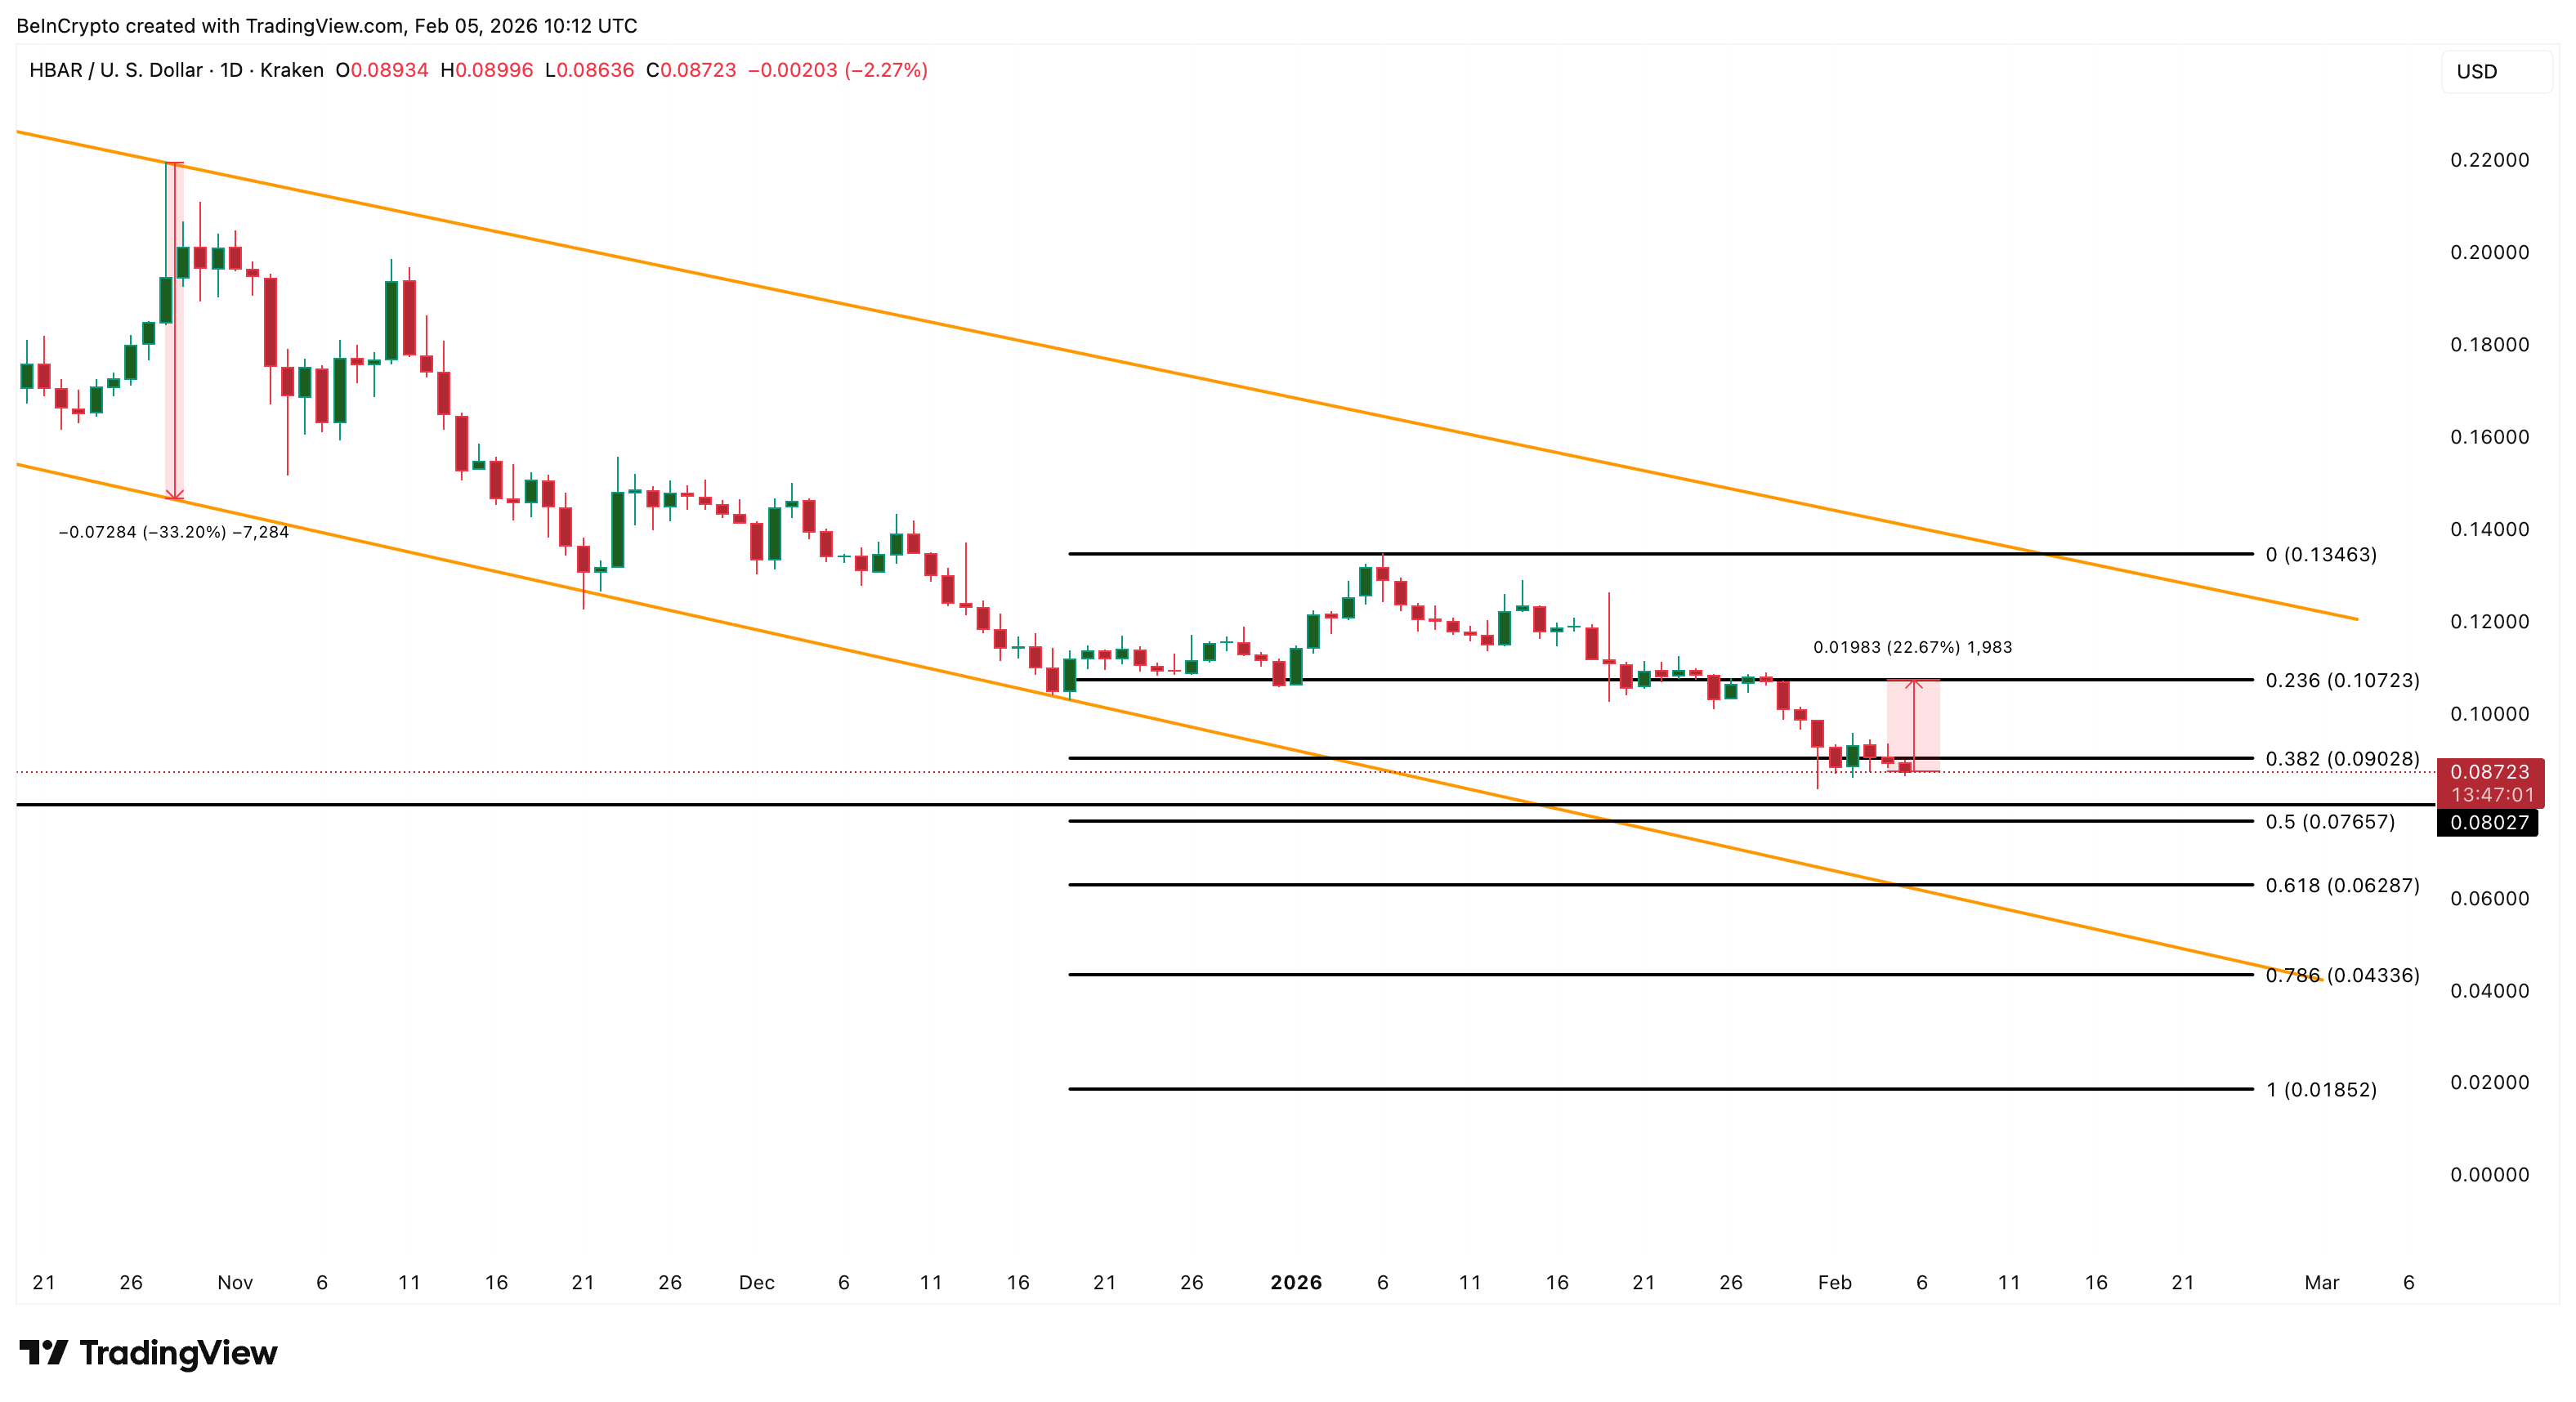
HBAR remains trapped inside a falling channel that has guided price lower since September, with a breakdown projection of around 30% if the lower trendline breaks.
The first major support sits near $0.080-$0.076. This zone has been in place since the October 10 crash. A daily close below it would weaken the structure. Below that, the next support lies near $0.062, based on Fibonacci extensions to the downside.
 HBAR Price Analysis: TradingView
If this level breaks, the channel projection points toward $0.043, opening the 30% breakdown path. On the upside, recovery remains difficult.
HBAR must first reclaim $0.107. A move above $0.134 is needed to break the bearish channel. But that likely requires:
- A sustained TVL rebound
- Consistent ETF inflows
Without both, any HBAR price bounce attempt may fade quickly.
Recommended Articles


