

Cardano on-chain indicators flash buy signals

Source Fxstreet
  • Cardano holders have consistently realized losses and shed ADA holdings nearly every day in April.
  • On-chain metrics show 40% of the wallets holding ADA are currently profitable, nearly 60% remain underwater. 
  • ADA has seen an increase in large wallet transactions alongside a price decline, whales are likely buying the dip. 

Cardano (ADA) investors have shed their holdings at a loss throughout April 2024, with the exception of a few days where profits were realized. On-chain metrics paint a bullish picture for Cardano price and generate buy signals. 

Cardano on-chain metrics turn bullish

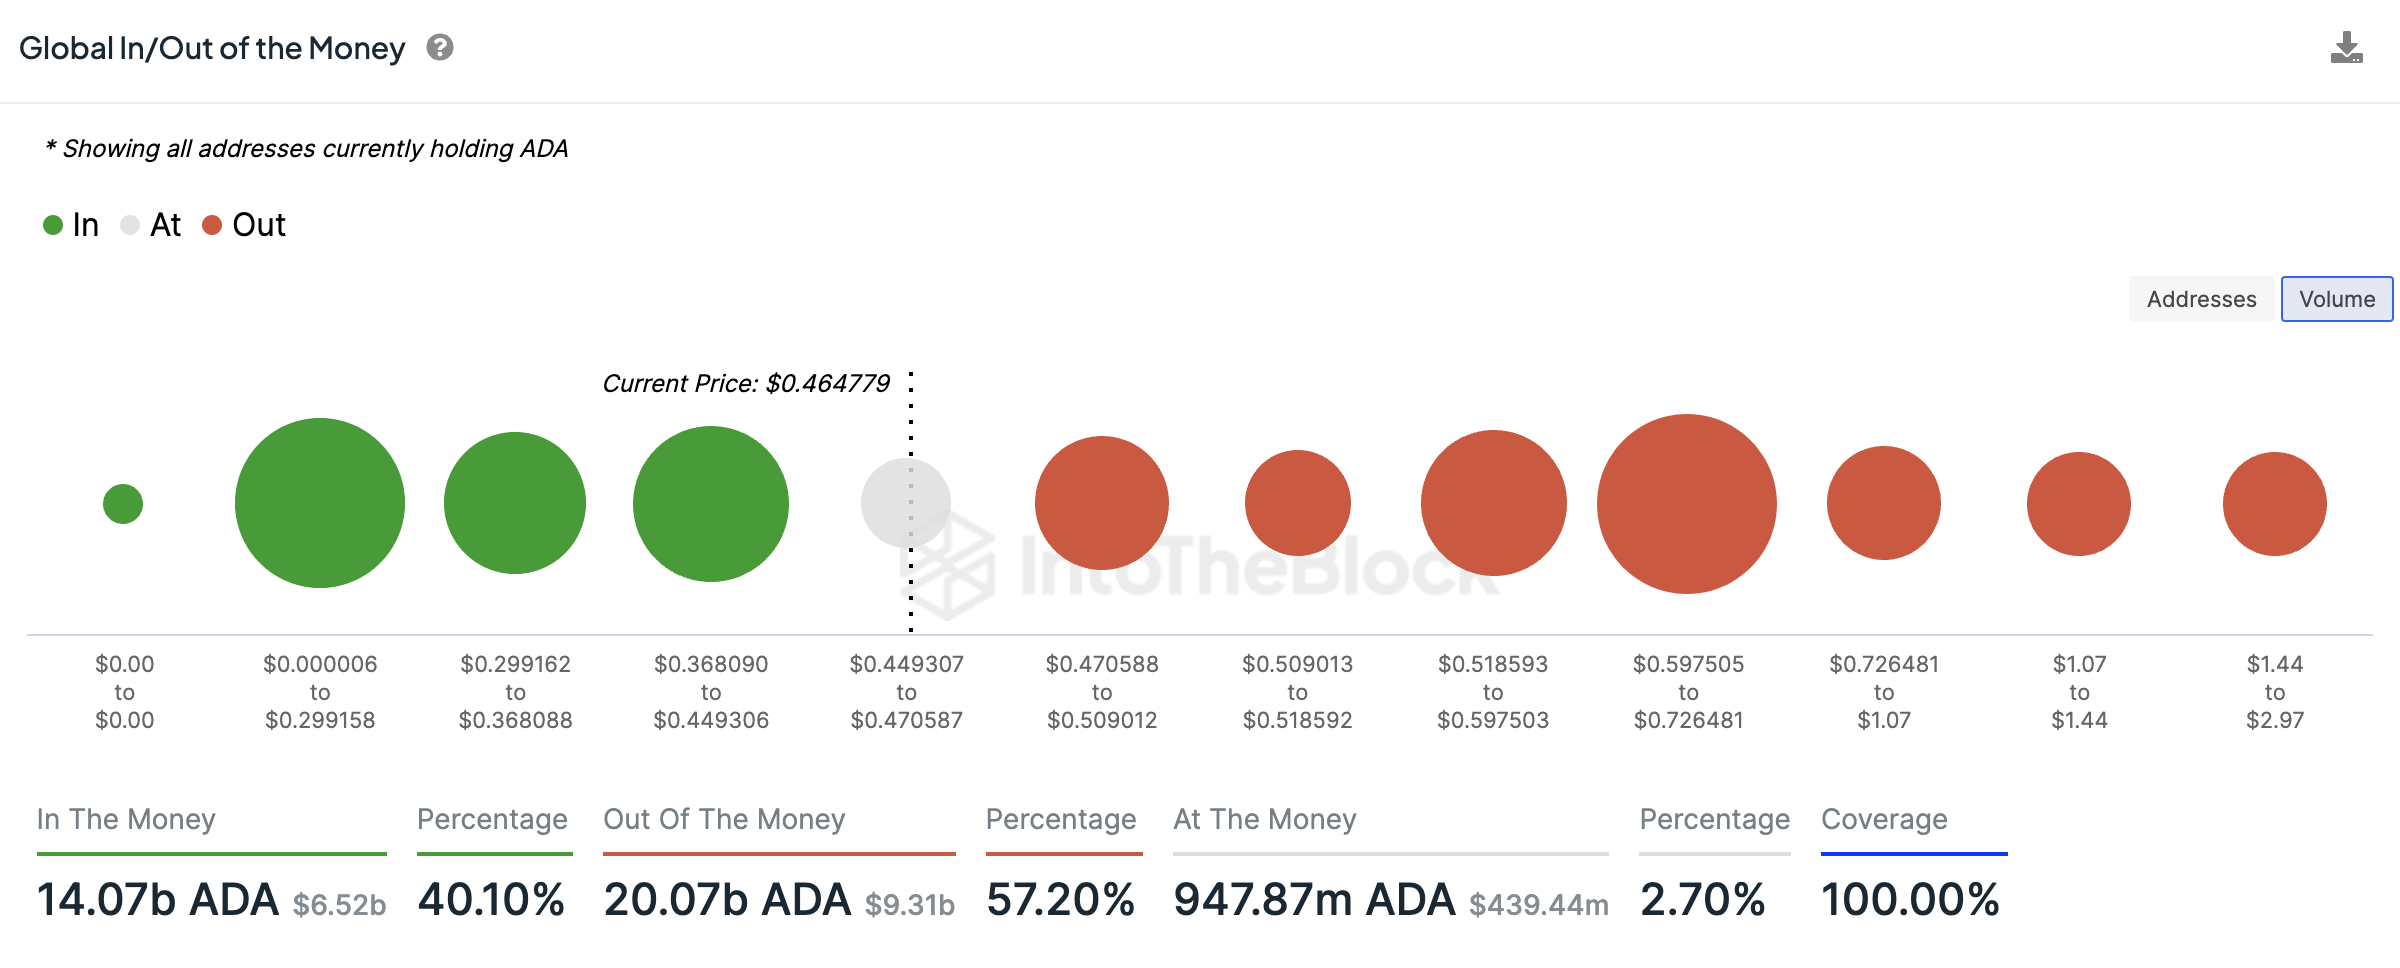
The Global In/Out of the Money (GIOM) indicator from crypto intelligence tracker IntoTheBlock that classifies addresses based on whether they are profiting (in the money), breaking even (at the money) or losing money (out of the money) on their positions at current price.

The GIOM for Cardano reveals that 40.10% of the wallet addresses holding ADA are currently profitable. Close to 60% wallet addresses are underwater or sitting on unrealized losses. Typically, when a large cohort of wallets (a higher percentage of addresses) is underwater, there is less likelihood of these entities shedding their ADA holdings. 

Selling ADA at the current price of $0.4647 would result in a loss for 57.20% of the wallet addresses holding the altcoin, thus reducing the likelihood of a sell-off. This may be considered a good time for sidelined buyers to “buy the dip,” preparing for the altcoin’s recovery. 
ADA

Global In/Out of the Money Cardano 

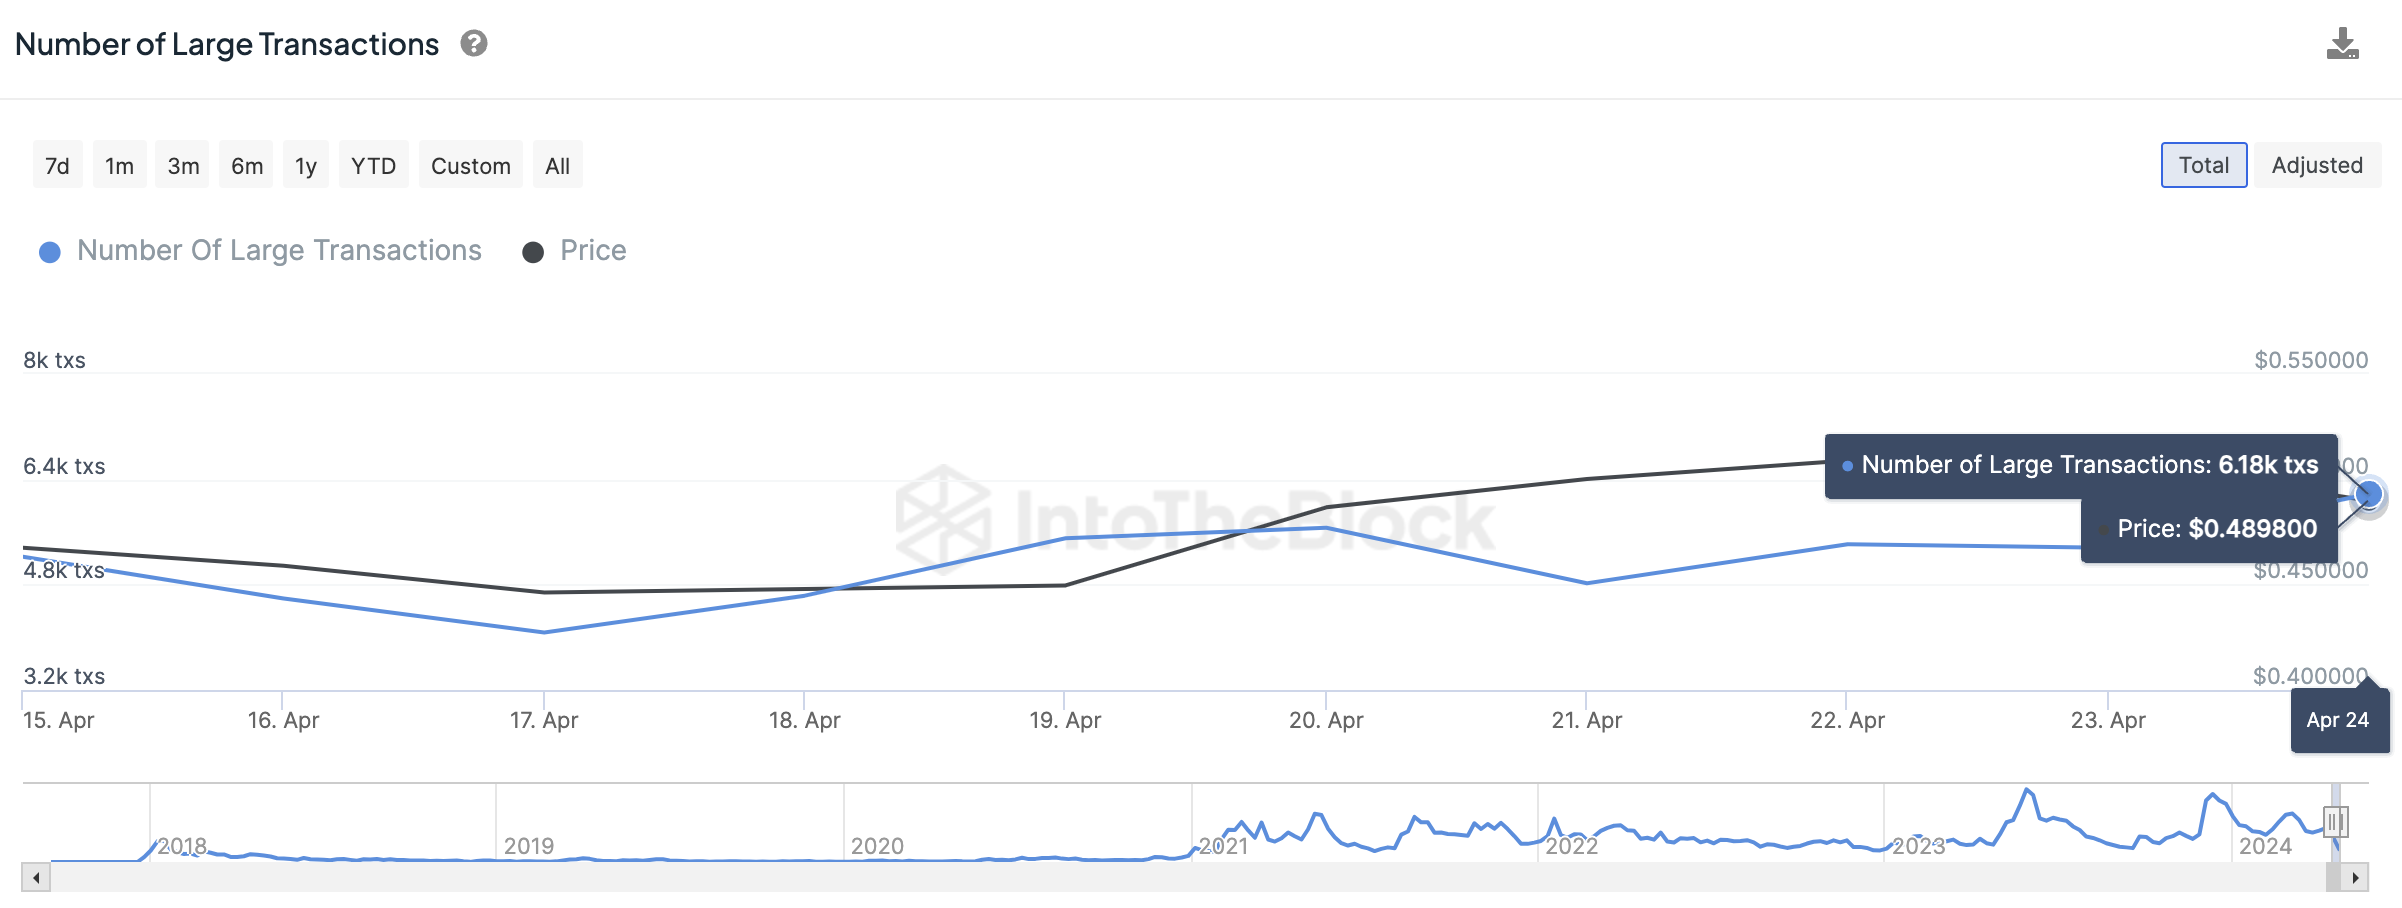
Additionally, the number of large transactions from IntoTheBlock is a metric that tracks transactions with a value greater than $100,000 on the Cardano blockchain. This helps identify whale activity. When combined with the asset’s price, the metric helps identify whale movements. 

The number of large transactions climbed to 6,180 on April 24, a single-day increase of 15%. At the same time, ADA price dropped nearly 4% to $0.4898. An increase in the count of large transactions combined with a price decrease signals the possibility of large wallet investors “buying the dip” or accumulating ADA. 
Cardano

Number of Large Transactions 

Cardano holders have consistently shed ADA tokens at a loss throughout April 2024, with the exception of a few days when net profit was realized by traders. The Network Realized Profit/Loss metric on Santiment calculates the net profit or loss (USD value) for all coins that were transacted over a fixed period of time. 

When combined with price, the metric provides a reflection of the aggregate market sentiment, capital inflows or outflows, and points towards capitulation or related events.

This is in line with capitulation in the altcoin, generating a buy signal for Cardano. 

Cardano

Network Realized Profit/Loss

At the time of writing, Cardano price is $0.4679 on Binance, down nearly 2% on the day. 

Disclaimer: For information purposes only. Past performance is not indicative of future results.
placeholder
WTI (USOIL) Is down 2.03% on Sep 25: Here Is WhyWTI (USOIL) is down 2.03% at Sep 24 22:20(UTC+0), now at $92.517, with a 7-day down of 3.63%.What is driving WTI (USOIL)’s stock price down today?The drop in WTI crude oil prices was primarily driven by
Author  TradingKey
15 hours ago
WTI (USOIL) is down 2.03% at Sep 24 22:20(UTC+0), now at $92.517, with a 7-day down of 3.63%.What is driving WTI (USOIL)’s stock price down today?The drop in WTI crude oil prices was primarily driven by
placeholder
Silver Price Forecast: XAG/USD remains steady near $64.00 as oil prices easeSilver price (XAG/USD) inches higher after two days of losses, trading around $63.90 per troy ounce during Asian hours on Friday. Non-yielding Silver is finding underlying support as inflation concerns ease following a pullback in crude oil prices.
Author  FXStreet
17 hours ago
Silver price (XAG/USD) inches higher after two days of losses, trading around $63.90 per troy ounce during Asian hours on Friday. Non-yielding Silver is finding underlying support as inflation concerns ease following a pullback in crude oil prices.
placeholder
Gold Price Forecast: Gold Drops Below $4,300, Will It Continue to Fall? As of the European session on September 24, gold prices (XAUUSD) extended their correction, dipping below $4,300 intraday to hit a low of $4,262.45. After previously rebounding close to $
Author  TradingKey
Yesterday 09: 57
As of the European session on September 24, gold prices (XAUUSD) extended their correction, dipping below $4,300 intraday to hit a low of $4,262.45. After previously rebounding close to $
placeholder
Yen touches 158.37 as Tokyo reopens, then slips back — ¥15.4 trillion of intervention and the 200-day line stand between here and 160USD/JPY reached 158.37 overnight, its highest since early September, then eased to 157.88 as Japanese markets reopened after a three-day holiday. The Ministry of Finance has spent ¥15.4 trillion defending the yen since late July and the BOJ ran a rate check on September 18. The 200-day average sits at 158.43.
Author  Irene Q.
Yesterday 06: 59
USD/JPY reached 158.37 overnight, its highest since early September, then eased to 157.88 as Japanese markets reopened after a three-day holiday. The Ministry of Finance has spent ¥15.4 trillion defending the yen since late July and the BOJ ran a rate check on September 18. The 200-day average sits at 158.43.
placeholder
US input costs rose at the fastest pace in four years — the September flash PMI beat is an inflation story, not a growth storyUS September flash PMIs came in far above expectations, with the composite at 58.4, a five-year high. But the detail that moved markets was input cost inflation at its fastest since October 2022, driven by fuel, transport and supply shortages. Brent is back above $100 and the 10-year Treasury yield has hit its highest since 2007.
Author  Suzie
Yesterday 06: 46
US September flash PMIs came in far above expectations, with the composite at 58.4, a five-year high. But the detail that moved markets was input cost inflation at its fastest since October 2022, driven by fuel, transport and supply shortages. Brent is back above $100 and the 10-year Treasury yield has hit its highest since 2007.
Related Instrument
goTop
quote