Near Protocol Price Prediction: NEAR fulfills targets but a 10% correction may be on the horizon

Source Fxstreet
  • Near Protocol price has completed a 55% mean reversal from the bottom of the market range at $4.27.
  • Amid growing bearish activity, NEAR could drop 10% to the $6.00 psychological level before a potential recovery.
  • A break and close above $7.95 would invalidate the downleg thesis.

Near Protocol (NEAR) price is trading with a bullish bias, and has completed a full swing recovery following a 42% drop. However, the recovery may be cut short as bears align to sell NEAR token.

Also Read: Near Protocol price poised for a strong rally if history rhymes

Near Protocol price risks 10% correction

After a 55% recovery rally from the April 13 low of $4.27, the Near Protocol price looks primed for a correction. With a huge supply zone hovering above the price between $6.98 and $8.90, the altcoin could make a 10% correction to find initial support around the $6.00 psychological level.

Based on the volume profile indicator, there is a lot of bearish activity near the $7.00 price level, just above the current NEAR token price. Large spikes of the volume profile (grey) have indicated this.  These spikes point to many sellers entering the NEAR market at current price levels and could potentially lead to a decrease in price if the selling pressure continues.

A series of bearish spikes on the volume profile could signal a potential trend reversal from bullish to bearish, indicating a shift in market sentiment and direction. For confirmation, traders should watch to see whether the Relative Strength Index (RSI) produces a lower high below the ‘50’ mean level on the daily timeframe.

In a dire case where the $6.00 level fails to hold as support, the Near Protocol price could extend the fall to the 50-day Smooth Moving Average (SMMA) at $5.31, or worse, test the $5.13 support level before a recovery.

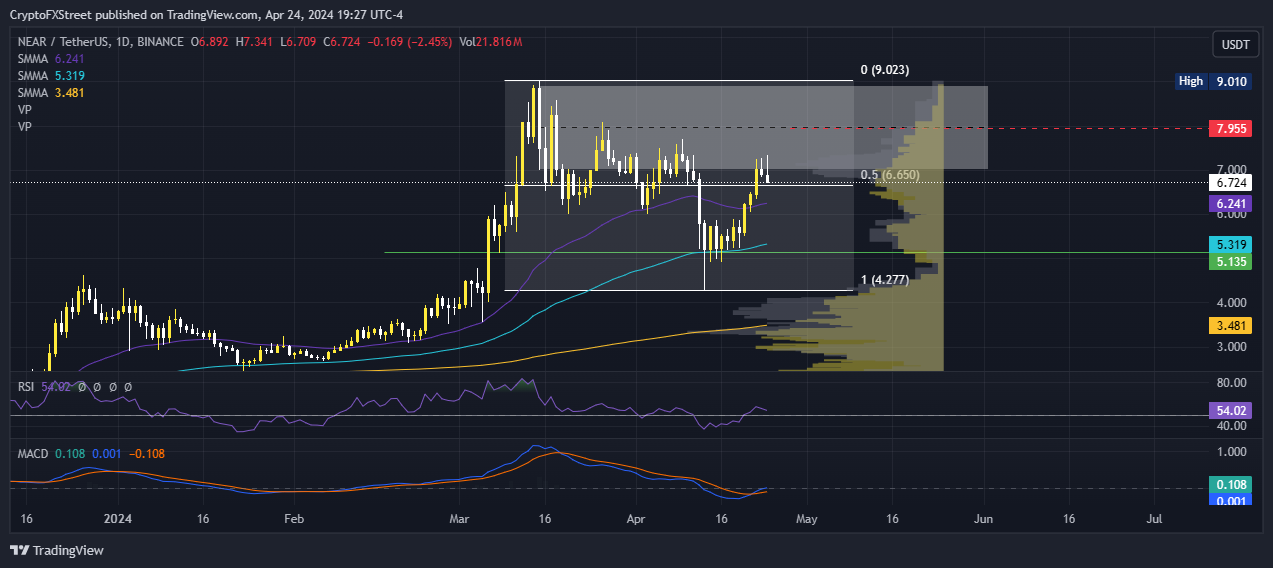
NEAR/USDT 1-day chart

On the other hand, if the bulls are able to break above the bearish cloud, confirmed by a daily candlestick close above the midline of the supply zone at $7.95, it would negate the bearish thesis. Such a directional bias could see NEAR price extend the gains to reclaim the $9.01 range high. 

Disclaimer: For information purposes only. Past performance is not indicative of future results.
placeholder
Gold price declines amid risk-on sentiment despite Fed rate cut expectationsGold price (XAU/USD) continues with its struggle to find acceptance above the $3,400 mark and attracts heavy selling during the Asian session on Monday.
Author  FXStreet
Aug 11, 2025
Gold price (XAU/USD) continues with its struggle to find acceptance above the $3,400 mark and attracts heavy selling during the Asian session on Monday.
placeholder
EUR/USD Price Forecast: Keeps bullish vibe above 1.1600 despite France’s deepening political crisisThe EUR/USD pair loses ground to near 1.1620 during the early European session on Monday.
Author  FXStreet
Oct 27, 2025
The EUR/USD pair loses ground to near 1.1620 during the early European session on Monday.
placeholder
ECB Policy Outlook for 2026: What It Could Mean for the Euro’s Next MoveWith the ECB likely holding rates steady at 2.15% and the Fed potentially extending cuts into 2026, EUR/USD may test 1.20 if Eurozone growth proves resilient, but weaker growth and an ECB pivot could pull the pair back toward 1.13 and potentially 1.10.
Author  Mitrade
Dec 26, 2025
With the ECB likely holding rates steady at 2.15% and the Fed potentially extending cuts into 2026, EUR/USD may test 1.20 if Eurozone growth proves resilient, but weaker growth and an ECB pivot could pull the pair back toward 1.13 and potentially 1.10.
placeholder
Gold plummets below $4,200 as US‑Iran tensions spur hawkish rate bets ahead of US CPIGold (XAU/USD) extends the recent breakdown momentum below a technically significant 200-day Simple Moving Average (SMA) and drops to a fresh low since March 23, further below the $4,200 mark during the Asian session on Wednesday.
Author  FXStreet
Yesterday 08: 26
Gold (XAU/USD) extends the recent breakdown momentum below a technically significant 200-day Simple Moving Average (SMA) and drops to a fresh low since March 23, further below the $4,200 mark during the Asian session on Wednesday.
placeholder
BTC Hovers Near 60,000 Mark After Plunge. US May CPI Set to Be Revealed, How Is Wall Street Betting?Bitcoin's rebound falters as the U.S.-Iran conflict and CPI data likely sustain downward pressure.On June 10, escalating U.S.-Iran tensions put the already fragile crypto market to the te
Author  TradingKey
Yesterday 09: 57
Bitcoin's rebound falters as the U.S.-Iran conflict and CPI data likely sustain downward pressure.On June 10, escalating U.S.-Iran tensions put the already fragile crypto market to the te
goTop
quote